Q2 exceeded expectations! S&P 500’s performance is impressive
As of now, over 90% of companies in the S&P 500 have reported actual performance for the second quarter of 2024.
Among them, 78% of the companies had actual earnings per share (EPS) exceeding expectations, which was 77% higher than the average of the past 5 years and 74% higher than the average of the past 10 years.
These companies’ earnings exceeded expectations by 3.5%, but this value is lower than the average of 8.6% over the past 5 years and 6.8% over the past 10 years.
These historical averages reflect the actual performance of all 500 companies, not just those that have reported performance so far.

S&P 500Q2 Performance Overview
As Q2 draws to a close, the performance of companies in the S&P 500 is somewhat mixed, with some earning more than expected but exceeding expectations by more than the average level in the past.
However, the overall return of the S&P 500 index is still higher than at the end of the previous quarter. Overall, the annual return growth rate of this index is the highest since the fourth quarter of 2021. Although there are pros and cons, overall, the revenue growth is still good!
Over the past week, communication service companies have reported negative EPS surprises, dragging down the overall S&P 500 index.
Although companies in the medical insurance and financial industries have performed well, the decline in communication services has slowed down overall revenue growth.
Starting from June 30th, companies in the financial, non essential consumer goods, and information technology industries raised their EPS expectations, partially offsetting the lowered expectations of companies in the communication services and energy industries, as well as unexpected negative EPS due to poor performance reports. The overall earnings growth of the S&P 500 index has increased!
Therefore, the S&P 500 index reported a decrease in Q2 earnings compared to last week, but still higher than the earnings reported at the end of the quarter.
Currently, the overall revenue growth rate for the second quarter (based on actual performance of reported companies and estimated performance of companies yet to be reported) is 10.8%, compared to 11.4% last week and 8.9% at the end of the second quarter (June 30).
If 10.8% is the actual quarterly growth rate, it will mean that this is the highest reported annual revenue growth rate since the fourth quarter of 2021 (31.4%). It will also be the fourth consecutive quarter of annual earnings growth for the S&P 500 index.
Nine out of all industries reported year-on-year growth in Q2 2024, with five industries including utilities, information technology, finance, healthcare, and non essential consumer goods experiencing double-digit growth.
In addition, two industries experienced a year-on-year decline in revenue, with the materials industry experiencing the largest decline.
59% of S&P 500 companies reported actual revenue exceeding expectations, which is lower than the average of 69% over the past 5 years and 64% over the past 10 years.
The company’s reported revenue was 0.5% higher than expected, lower than the average of 2.0% over the past 5 years and 1.4% over the past 10 years.
If 0.5% is the quarterly actual value, then this will be the lowest reported percentage of revenue exceeding expectations since the fourth quarter of 2019 (0.5%).
Similarly, these historical averages reflect the actual performance of all 500 companies, not just those that have reported performance so far.
The S&P 500 index’s Q2 revenue reported today remained stable compared to last week, but still higher than the revenue reported at the end of the quarter.
Currently, the comprehensive revenue growth rate for the second quarter is 5.2%, which is the same as last week and has increased from 4.7% at the end of the second quarter (June 30).
If 5.2% is the actual revenue growth rate for the quarter, it would mean the highest reported revenue growth rate since the fourth quarter of 2022 (5.4%). This will also be the 15th consecutive quarter of revenue growth for the S&P 500 index.
Analysts expect annual (year-on-year) earnings growth rates of 5.4% and 15.7% for the third and fourth quarters of 2024, respectively. For the full year of 2024, analysts expect an annual revenue growth rate of 10.2%.
The price to earnings ratio for the next 12 months is 20.2 times, higher than the average of 19.4 times over the past 5 years and 17.9 times over the past 10 years.
However, this P/E ratio is lower than the 21.0 times P/E ratio recorded at the end of the second quarter (June 30).
In the coming week, it is expected that nine S&P 500 index companies (including three Dow Jones 30 index component companies) will report their second quarter performance.

Summary of Q2 2024
The S&P 500 companies have a high proportion of earnings exceeding expectations, but the magnitude is low.
The overall revenue and income growth rate remain at a high level, although some industries show significant differentiation in performance.
Future earnings expectations remain optimistic, but an increase in price to earnings ratio may attract market attention.
This analysis reflects the financial performance and future expectations of S&P 500 index companies in the second quarter of 2024, providing investors with important market insights.
Q2 2024:Scorecard

(Figure 1)

(Figure 2)
Q2 2024:Growth

(Figure 3)

(Figure 4)
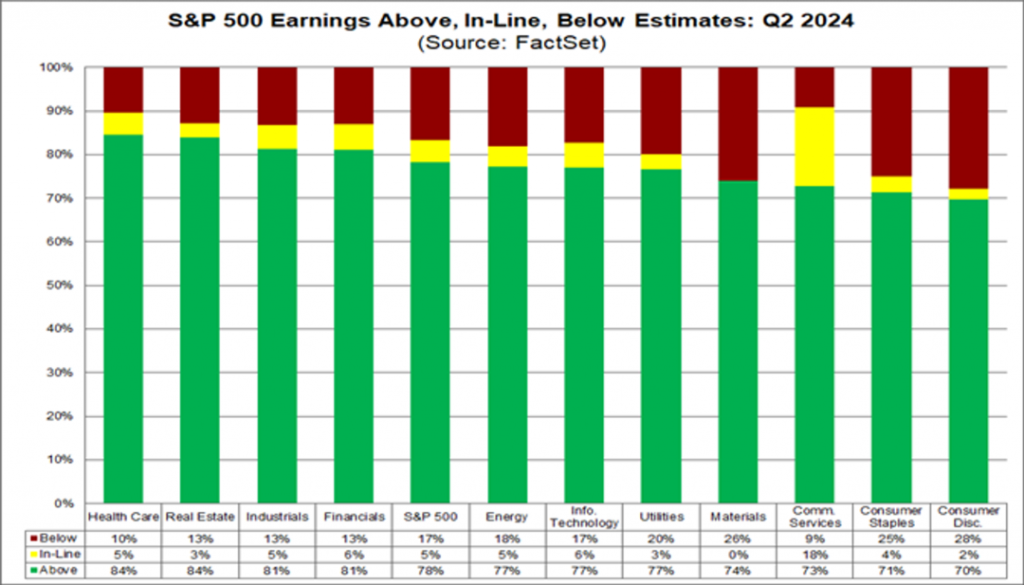
Figure 1: S&P 500 earnings exceeding, meeting, and falling below expectations: Q2 2024
The chart displays statistics on the earnings performance of various industries in the S&P 500 in Q2 2024.
Most industries have a higher proportion of earnings exceeding expectations (green), but the communication services industry, consumer necessities, and non essential sectors have a higher proportion of earnings below expectations (red).
More than 80% of companies in the healthcare, real estate, industrial, and financial industries reported earnings exceeding expectations.
The healthcare industry has shown the most outstanding performance, with only 10% of companies experiencing lower than expected earnings.
More than 20% of companies in the communication services and non essential consumer goods industries have lower than expected earnings.
This means that there are significant differences in the degree to which a company’s profitability aligns with market expectations across different industries.
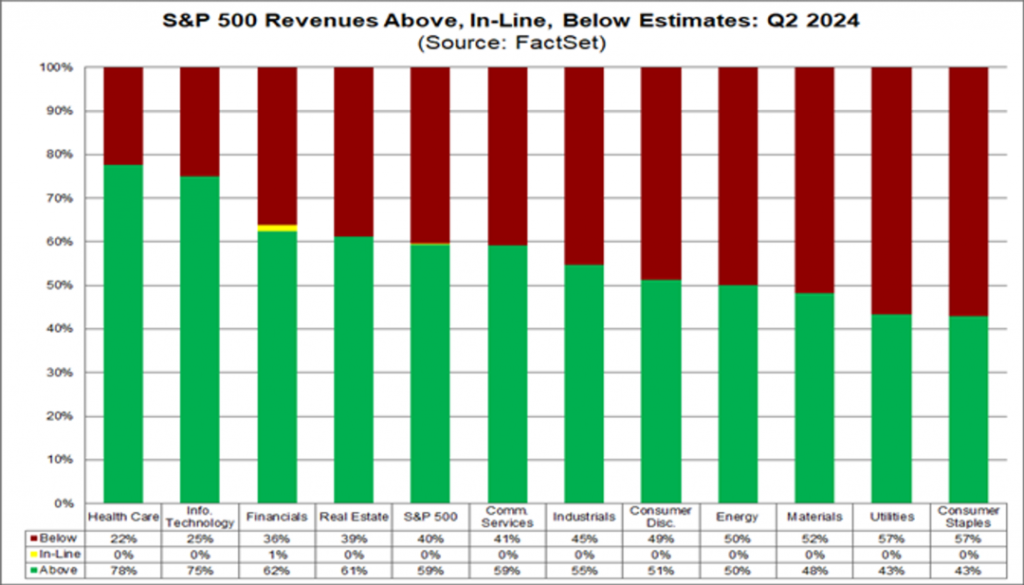
Figure 2: S&P 500 Revenue Exceeded, Meets, and Underestimates: Q2 2024
In terms of revenue, the chart shows that over half of the companies have lower than expected revenue in multiple industries (red). Especially in the fields of public utilities, materials, energy, and industry.
The healthcare and information technology industries have performed well, with over 70% of companies exceeding their revenue expectations. Especially in information technology, the proportion reaches 78%.
The revenue performance of the financial, real estate, communication services, and industrial industries is relatively mediocre, with 36% of companies in the financial industry having lower than expected revenue.
In Q2 2024, the company faces significant challenges in generating revenue, particularly in traditional industries.
The information technology and healthcare industries continue to lead the market, demonstrating strong revenue growth potential.
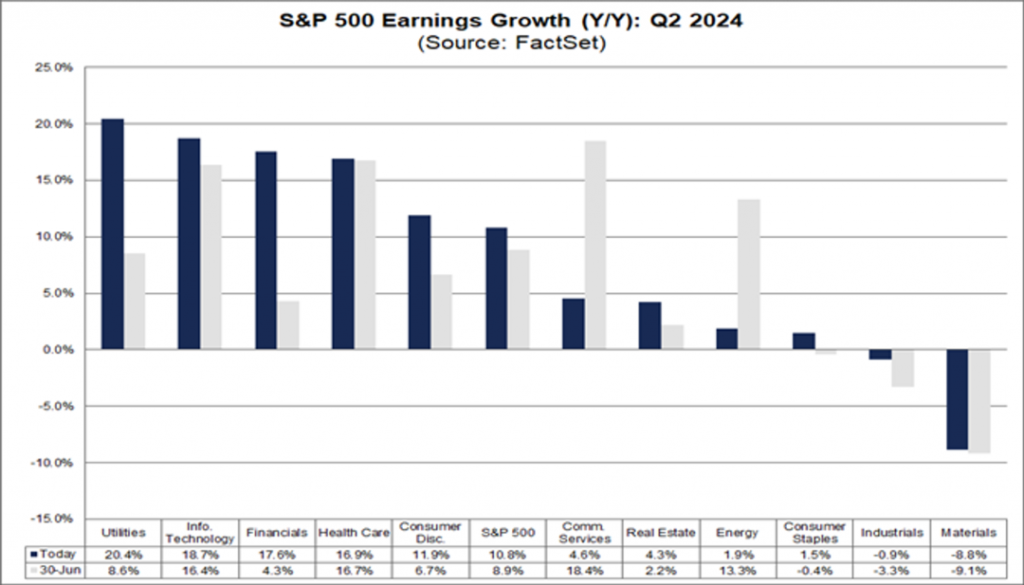
Figure 3: S&P 500 Revenue Growth (YoY): Q2 2024
The chart shows the year-on-year revenue growth rates of various industries in the S&P 500 for Q2 2024.
The revenue growth rates of the public utilities and information technology industries are particularly prominent, at 20.4% and 18.7% respectively, demonstrating strong growth momentum.
However, the materials and industrial industries experienced negative growth in revenue, with a 9.1% decline in the materials industry.
These industries may have been affected by global demand slowdown, rising costs, and other factors, while the revenue growth of finance, healthcare, and consumer industries is relatively robust.
The data shows that the overall economic environment in Q2 2024 has a significant impact on certain industries, especially those closely related to global supply chains and commodity prices. Meanwhile, industries such as technology and utilities continue to maintain strong growth.
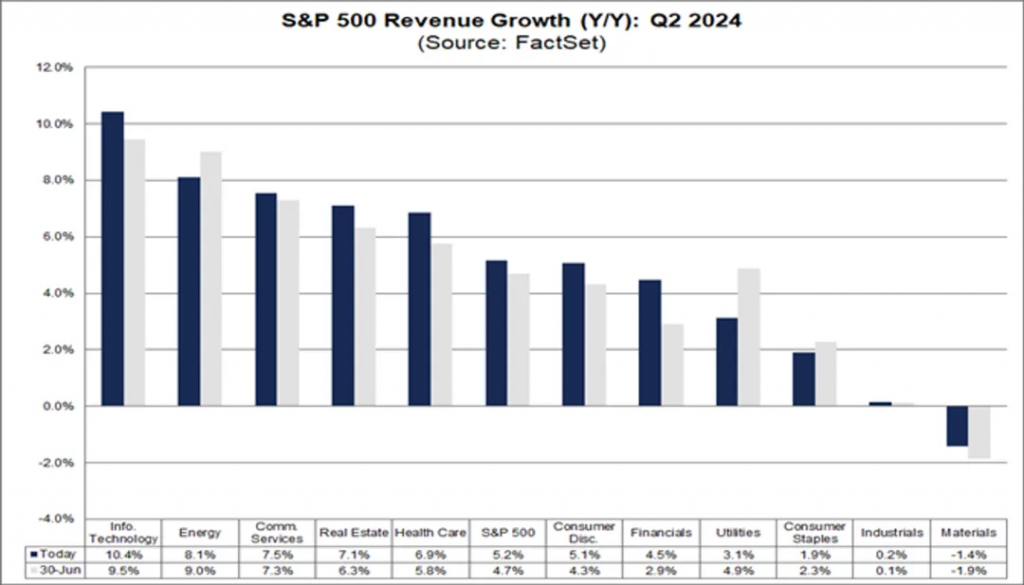
Figure 4: S&P 500 Revenue Growth (YoY): Q2 2024
The chart shows the year-on-year revenue growth rates of various industries in the S&P 500 for Q2 2024.
The information technology and energy industries have the highest revenue growth rates, at 10.4% and 8.1% respectively, demonstrating their significant role in driving revenue growth.
However, income in the industrial and materials industries has declined, especially in the materials sector. The chart shows that these industries are facing challenges in the current economic environment, such as weak demand and price pressures.
The technology, energy, and communication services industries have shown strong growth trends, while the performance of the industrial and materials industries reflects greater uncertainty and challenges.
Overall, the driving force for revenue growth in the second quarter of 2024 mainly comes from the rise in innovative technologies and energy demand.
Through analysis, it can be seen that the overall profitability of S&P 500 companies in the second quarter of 2024 is strong, especially in industries such as technology and utilities. Despite the pressure faced by certain industries such as materials and industry, the overall market growth momentum remains robust.
Investors can pay attention to potential opportunities in these growth driven industries.
The global panic trading is coming to an end. Start at the low point and assess the situation accordingly.
Disclaimer: The content of this article is for reference only and does not constitute investment advice. Investment carries risks, and caution is necessary when entering the market.
Leave a Reply