💡 The earnings season has entered an exciting week with major tech giants reporting their results!
Next week, the market is expected to experience heightened volatility due to the upcoming Federal Reserve FOMC meeting, several key earnings reports from major tech companies, and the monthly employment report on Friday. Given that the stock market is currently in an overbought technical state, we may face risks from “news sell-offs” or downward adjustments following the earnings reports of large tech stocks. Therefore, the outlook for next week is “high volatility” with a slightly bearish bias overall. It’s important to note that February has historically been the worst month for tech stocks over the past 20 years. However, if the earnings reports and guidance from major tech firms are exceptionally strong, they could push the market higher and delay any potential tech stock correction.
Last Week’s Market Review and Earnings Summary:
Last week, the market continued to fluctuate at high levels, with the three major U.S. stock indices consolidating at high points. The Dow Jones and the S&P indices reached historic new highs, showing considerable strength.

From the weekly trend of the major indices, the Russell 2000 Index led with a weekly gain of 1.84%, followed by the S&P Index with a 1.06% increase, the Dow Jones with 0.65%, and the Nasdaq with 0.62% at the “bottom” among the indices. Last week, the strategist’s overall outlook for the market was “bullish,” and they pointed out the technical significance of the S&P 500 Index (SPX) breaking through historical highs. The SPX closed higher every day this week and set another historical high (intraday) at 4,906 today. Technology stocks continued to drive the bullish momentum this week, with the Nasdaq 100 Index (NDX) and the Philadelphia Semiconductor Index also reaching historical highs.
Economic Data Level:
Summarizing the data for the week, there was evidence of a strong U.S. economy and cooling price inflation, which supports the bullish argument that the U.S. economy is poised for a soft landing, as strategists have long been optimistic about. Yesterday, the Q4 GDP estimate came in at 3.3%, significantly higher than the economists’ expected 2.2%, driven by personal spending. In the GDP report, the core price index was at 2.0%, the lowest level since June 2020. Other evidence of deflationary trends in the Personal Consumption Expenditure Price Index (PCE) emerged. Although the overall and core PCE monthly data were in line [both at +0.2%, as expected, and the Federal Reserve’s preferred inflation indicator], the annual core PCE index slowed to 2.9% (from 3.2% in November, below the expected 3.0%), the lowest reading since March 2021.
Elsewhere, the S&P Global U.S. Composite PMI rose to 52.3 in January from 50.9 in December, hitting a seven-month high and surpassing market expectations of 51.0. Also noteworthy in the report was that the business confidence index reached a 20-month high, and the price change index rose at the slowest pace since May 2020.
In terms of labor, although the initial jobless claims were higher than expected (214K vs. 192K estimate), the 187K initial jobless claims from the previous week were the lowest since September 2022. The number of continuing claims for unemployment benefits rose slightly to 1.833M this week, above economists’ expectations of 1.828M. A reminder that we will receive the non-farm payroll data on Friday.
From a weekly perspective, the yield on the 10-year U.S. Treasury note (TNX) fluctuated during the week but ended essentially flat compared to last Friday, currently at 4.143%. Chart-wise, as TNX approaches the 4.20% level this year, buyers seem to step in, so this could be a level to watch in relation to stocks. This means that if TNX breaks above the 4.20% level, it could challenge the comfort level of stock bulls and translate into some profit-taking in equities. Currently, Bloomberg sees about a 48% chance of a rate cut by the Federal Reserve in March, essentially flat compared to last Friday. However, if we go back two Fridays, that probability was at 82%, so the market seems to be tempering expectations for the Federal Reserve’s rate policy. This is not surprising, as expectations around the Federal Reserve’s rate cuts have been pushed further out over the past year. We will get a better understanding of the Federal Reserve’s stance at next week’s FOMC meeting.
Core weekly earnings summary:
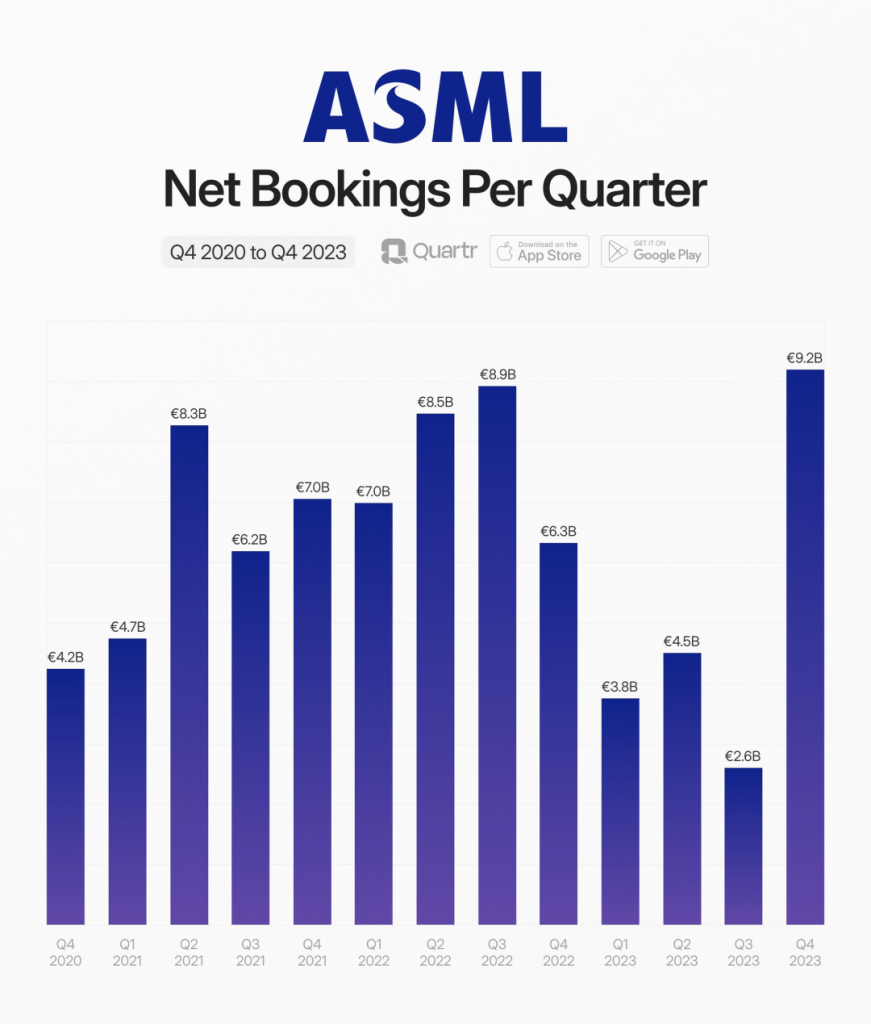
- Semiconductor giants: TSMC and ASML’s strong financial reports have driven semiconductor companies to surge continuously since the beginning of the year. Orders for financial reports continue to exceed expectations. Taking ASML, the mother of semiconductors, as an example, net bookings increased by +45%, +253% q/q, with memory at 47%, logic at 53%, and extreme ultraviolet light at 61%. This indicates that ASML’s high-end process expansion cycle has officially begun. In 2023, ASML’s stock performance lags behind Applied Materials, Lam Research, and KLA, but with the surge of AI in 2024 and the start of the 3nm expansion cycle, there is a strong optimism for ASML’s upward cycle.
2. Consumer internet giant Netflix’s explosive new subscriptions have driven a collective surge among internet giants.
3. Traditional software service providers like SAP and IBM have exceeded expectations with their performance, leading to a resurgence for these established companies.
4. SaaS exemplar ServiceNow has also exceeded expectations in performance, driven by AI.
Overall, the most frustrated giant of the week was undoubtedly Tesla, with its continuously declining gross margin, slowing sales, and even a direct omission of the 2024 sales outlook, leading investors to vote with their feet. The biggest highlight for Tesla in 2024 will be whether it can capture more market share after price reductions and expand its base of existing car owners to strive for more active users for the launch of FSD. In addition, some chip companies are struggling, such as TXN, INTC, and KLAC, so we need more data points to assess the Q4 earnings season for tech stocks. Investors won’t have to wait long, as we will receive reports from most of the “Magnificent 7” companies this week – Apple (AAPL), Amazon (AMZN), Alphabet (GOOG), Microsoft (MSFT), and Meta (META).
Outlook for Next Week:
With numerous earnings disclosures on the horizon, traders should prepare for potentially higher volatility next week. After a continuous surge, each giant will be tested by their performance, and even a slight miss could lead to significant market fluctuations. Additionally, this week will see the Federal Open Market Committee (FOMC) meeting, the release of several key large-cap tech stock earnings, and the monthly employment report on Friday. Coupled with the technically overbought stock market, I am concerned that we might be preparing for “sell the news” events in large-cap tech reports and/or consolidation declines. Therefore, the outlook for next week is “high volatility,” with the performance of the Magnificent Seven determining market trends.
Key economic data for next week includes:
- Tuesday (January 30th): Consumer Confidence Index, FHFA House Price Index, S&P Case-Shiller House Price Index
- Wednesday (January 31st): ADP Employment Change, EIA Crude Oil Inventories, Employment Cost Index, FOMC Rate Decision, MBA Mortgage Applications Index
- Thursday (February 1st): Construction Spending, Continuing Jobless Claims, Initial Jobless Claims, ISM Manufacturing Index, Productivity Preliminary, Unit Labor Cost Preliminary
- Friday (February 2nd): Non-Farm Payrolls, Average Hourly Earnings, Unemployment Rate, Factory Orders, University of Michigan Consumer Sentiment Index – Final
Earnings:
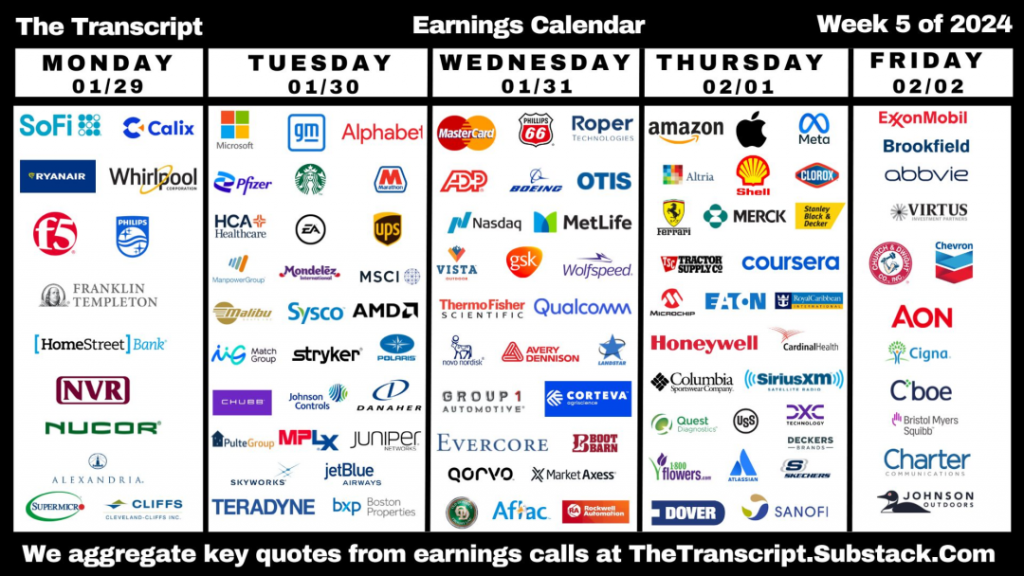
- Monday (January 29th): Alexander Real Estate Equities, F5 Inc. (FFIV), Nucor Co. (NUE), Super Micro Computer (SMCI), Whirlpool Corp. (WHR)
- Tuesday (January 30th): Microsoft Corp. (MSFT), Advanced Micro Devices Inc. (AMD), Alphabet Inc. (GOOG), Danaher Corp. (DHR), General Motors (GM), HCA Healthcare (HCA), Pfizer (PFE), Starbucks Corp. (SBUX), United Parcel Service (UPS)
- Wednesday (January 31st): Aflac (AFL), Automatic Data Processing (ADP), Boeing Co. (BA), Mastercard (MA)
- Thursday (February 1st): Amazon.com Inc. (AMZN), Apple Inc. (AAPL), Honeywell International (HON), Merck & Co. (MRK), Meta Platforms (META), Microchip Technology (MCHP)
- Friday (February 2nd): AbbVie (ABBV), Bristol-Myers Squibb (BMY), Exxon Mobil (XOM), Chevron (CVX), Cigna (CI), Regeneron Pharmaceuticals (REGN)
Key Focuses:
$GM, $GOOG, $MA, $CDLX, $PHG, $ROP, $AMZN, $XOM, $MSFT, $META, $BAM, $WHR, $PFE, $ABT, $HON, $OTIS, $MO, $CLX, $ABBV, $BA, $SHEL, $HCA, $EA, $UPS, $NDAQ, $MET, $MRK, $DECK, $VIRT, $RACE, $CVX, $MDLZ, $MSCI, $V, $GSK, $WLF, $COUR, $BEN, $TEAP, $MBUU, $SYY, $AMD, $TMO, $QCOM
Key Points of Interest:
- How much can AMD’s expected sales of AI chips in the data center be increased? Is Keybanc’s $8 billion target for 2024 possible?
- Where is the cycle of the entire cloud computing industry, and what is the situation with cloud optimization? Is cloud optimization over?
- Did the cloud growth rates of several major manufacturers show an upward inflection point this quarter, and what is the outlook for capex in 2024? These will be more specifically outlined in the earnings reports.
- The progress of AI across major companies, such as Microsoft’s AI Azure, AI Copilot revenue outlook, Google’s Performance Max revenue outlook, and other tech giants including Atlassian’s AI progress.
Technical Review:
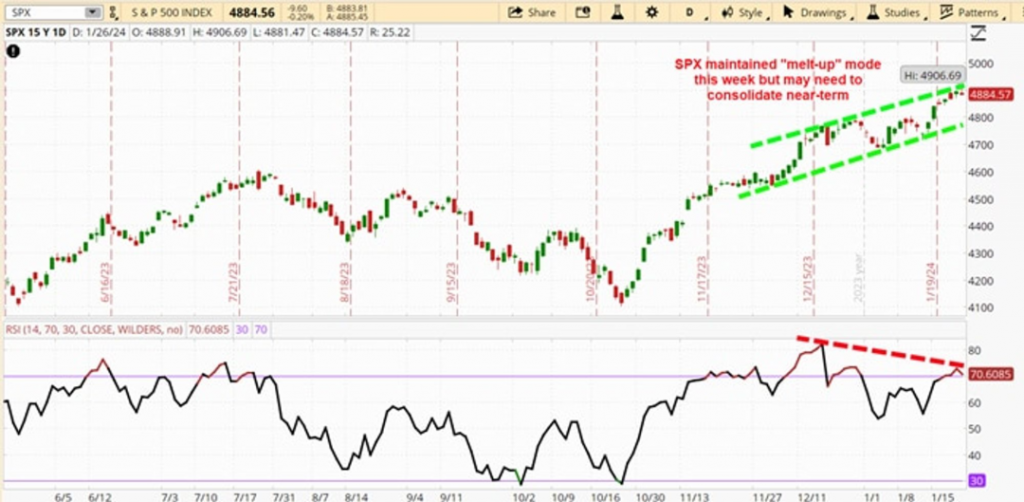
This week, the S&P 500 Index reached a historical high of 4,909 points. Historical highs can be a bullish event as they can trigger short covering and attract funds from the sidelines, which was the case this week. However, with the RSI above 70, we seem to be stretched in the short term. Alternatively, if you draw a recent uptrend channel for the index, you can see that we are at the ceiling of the channel, indicating that we may need some consolidation. Therefore, if the SPX should at best pause (sideways consolidation period), or possibly need to pull back and digest some of the recent gains. Near-term technical outlook: slightly bearish.
Source: ThinkorSwim trading platform. Past performance does not guarantee future results.
Nasdaq 100 Index:
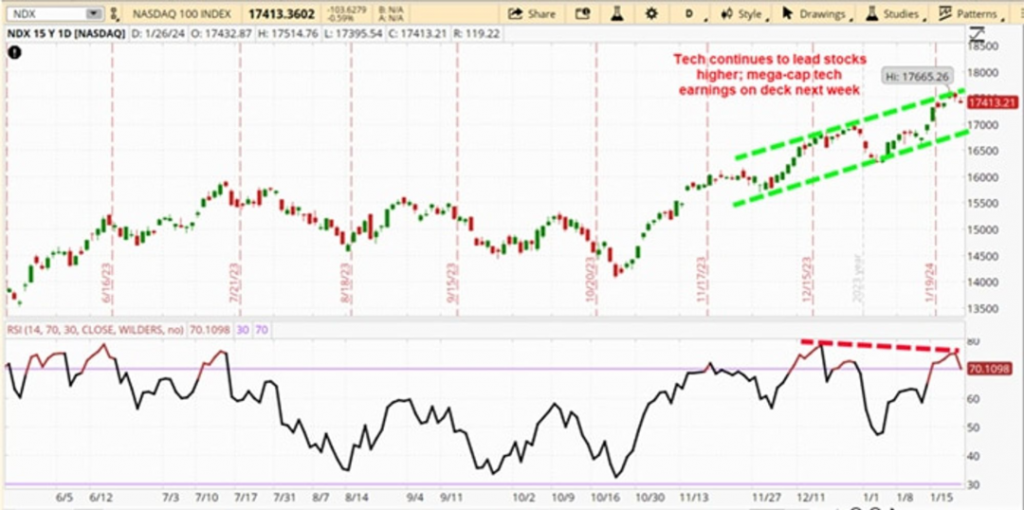
Like the SPX, the Nasdaq 100 Index reached a historical high this week. The influx of funds into tech stocks is evident, but we are still technically overbought, with a negative divergence in the RSI indicator. A negative divergence in the RSI may indicate that the trend is changing, and uptrends are usually resolved by sideways consolidation or pulling back. Can large-cap tech stocks achieve earnings next week and push the NDX to new heights? Of course, it is possible. However, with MSFT, AMZN, GOOG, and META all trading at historical highs or 52-week highs, the situation is not good. This setup could lead to a “sell the news” reaction, regardless of what they report (i.e., good news is already priced in). Furthermore, as we enter February, seasonal factors favor bears, as it is the month when the Nasdaq Index has performed the worst over the past 20 years. I may have called for some sort of technical correction before next week early, but at least I am preparing for this possibility, just in case it does not manifest as quickly as anticipated. Near-term technical outlook: bearish.
Source: ThinkorSwim trading platform. Past performance does not guarantee future results.
Market Breadth:
Below is a Bloomberg chart showing the current percentage of stocks trading above their respective 200-day simple moving averages in the S&P 500 Index, Nasdaq Composite Index, and Russell 2000 Index. Market breadth improved/increased this week but has retreated from its highs at the end of November/beginning of December. As the SPX, DJI, and NDX reached historical highs this week, ideally, market breadth would reach new cyclical highs along with the indices, but that has not been the case. Compared to last Friday, the SPX (white line) width increased from 70.68% to 72.69%, COMPX (blue line) from 47.02% to 49.72%, and RUT (red line) from 54.93% to 60.78%.
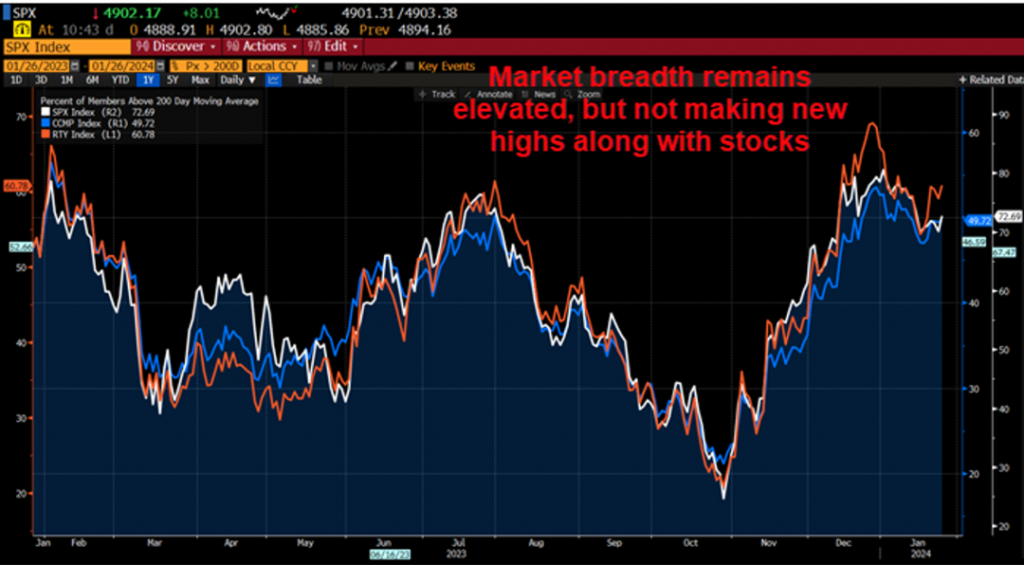
Market breadth attempts to capture the participation of individual stocks within the overall index, which helps to convey the potential strength or weakness of trends or movements. Generally, broader participation indicates healthy investor sentiment and technical support. There are numerous data points that can help convey market breadth, such as the ratio of advancing to declining issues, the percentage of stocks in an index that are above or below their long-term moving averages, or the number of new highs and new lows.
Leave a Reply