Blog

  • S&P 500 Q2 performance exploded! 78% of companies exceed expectations, but why isn’t the market buying? US Stock ETF Investment

    Q2 exceeded expectations! S&P 500’s performance is impressive

    As of now, over 90% of companies in the S&P 500 have reported actual performance for the second quarter of 2024.

    Among them, 78% of the companies had actual earnings per share (EPS) exceeding expectations, which was 77% higher than the average of the past 5 years and 74% higher than the average of the past 10 years.

    These companies’ earnings exceeded expectations by 3.5%, but this value is lower than the average of 8.6% over the past 5 years and 6.8% over the past 10 years.

    These historical averages reflect the actual performance of all 500 companies, not just those that have reported performance so far.

    S&P 500Q2 Performance Overview

    As Q2 draws to a close, the performance of companies in the S&P 500 is somewhat mixed, with some earning more than expected but exceeding expectations by more than the average level in the past.

    However, the overall return of the S&P 500 index is still higher than at the end of the previous quarter. Overall, the annual return growth rate of this index is the highest since the fourth quarter of 2021. Although there are pros and cons, overall, the revenue growth is still good!

    Over the past week, communication service companies have reported negative EPS surprises, dragging down the overall S&P 500 index.

    Although companies in the medical insurance and financial industries have performed well, the decline in communication services has slowed down overall revenue growth.

    Starting from June 30th, companies in the financial, non essential consumer goods, and information technology industries raised their EPS expectations, partially offsetting the lowered expectations of companies in the communication services and energy industries, as well as unexpected negative EPS due to poor performance reports. The overall earnings growth of the S&P 500 index has increased!

    Therefore, the S&P 500 index reported a decrease in Q2 earnings compared to last week, but still higher than the earnings reported at the end of the quarter.

    Currently, the overall revenue growth rate for the second quarter (based on actual performance of reported companies and estimated performance of companies yet to be reported) is 10.8%, compared to 11.4% last week and 8.9% at the end of the second quarter (June 30).

    If 10.8% is the actual quarterly growth rate, it will mean that this is the highest reported annual revenue growth rate since the fourth quarter of 2021 (31.4%). It will also be the fourth consecutive quarter of annual earnings growth for the S&P 500 index.

    Nine out of all industries reported year-on-year growth in Q2 2024, with five industries including utilities, information technology, finance, healthcare, and non essential consumer goods experiencing double-digit growth.

    In addition, two industries experienced a year-on-year decline in revenue, with the materials industry experiencing the largest decline.

    59% of S&P 500 companies reported actual revenue exceeding expectations, which is lower than the average of 69% over the past 5 years and 64% over the past 10 years.

    The company’s reported revenue was 0.5% higher than expected, lower than the average of 2.0% over the past 5 years and 1.4% over the past 10 years.

    If 0.5% is the quarterly actual value, then this will be the lowest reported percentage of revenue exceeding expectations since the fourth quarter of 2019 (0.5%).

    Similarly, these historical averages reflect the actual performance of all 500 companies, not just those that have reported performance so far.

    The S&P 500 index’s Q2 revenue reported today remained stable compared to last week, but still higher than the revenue reported at the end of the quarter.

    Currently, the comprehensive revenue growth rate for the second quarter is 5.2%, which is the same as last week and has increased from 4.7% at the end of the second quarter (June 30).

    If 5.2% is the actual revenue growth rate for the quarter, it would mean the highest reported revenue growth rate since the fourth quarter of 2022 (5.4%). This will also be the 15th consecutive quarter of revenue growth for the S&P 500 index.

    Analysts expect annual (year-on-year) earnings growth rates of 5.4% and 15.7% for the third and fourth quarters of 2024, respectively. For the full year of 2024, analysts expect an annual revenue growth rate of 10.2%.

    The price to earnings ratio for the next 12 months is 20.2 times, higher than the average of 19.4 times over the past 5 years and 17.9 times over the past 10 years.

    However, this P/E ratio is lower than the 21.0 times P/E ratio recorded at the end of the second quarter (June 30).

    In the coming week, it is expected that nine S&P 500 index companies (including three Dow Jones 30 index component companies) will report their second quarter performance.

    Summary of Q2 2024

    The S&P 500 companies have a high proportion of earnings exceeding expectations, but the magnitude is low.

    The overall revenue and income growth rate remain at a high level, although some industries show significant differentiation in performance.

    Future earnings expectations remain optimistic, but an increase in price to earnings ratio may attract market attention.

    This analysis reflects the financial performance and future expectations of S&P 500 index companies in the second quarter of 2024, providing investors with important market insights.

    Q2 2024:Scorecard

    (Figure 1)

    (Figure 2)

    Q2 2024:Growth

    (Figure 3)

    (Figure 4)

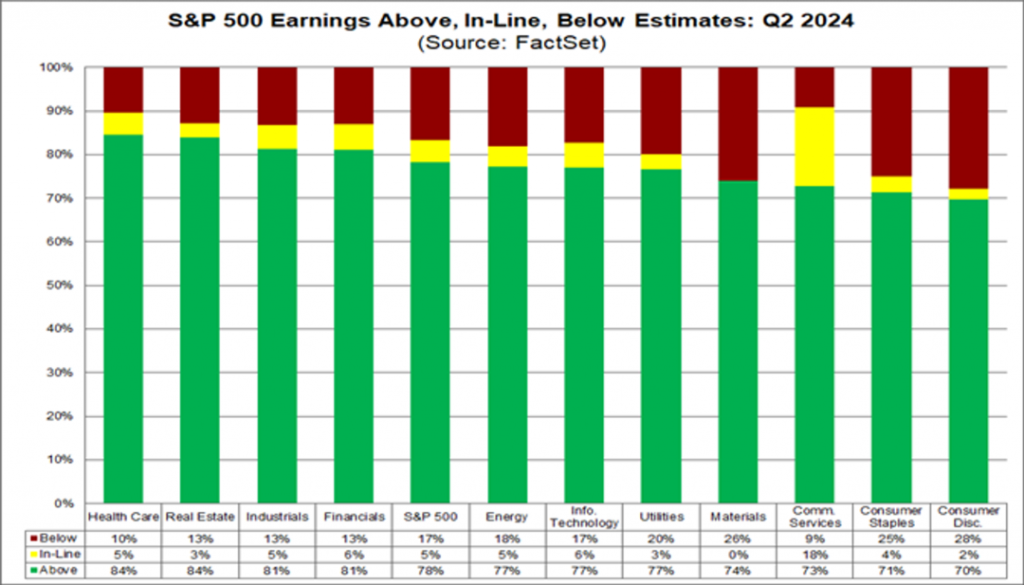
    Figure 1: S&P 500 earnings exceeding, meeting, and falling below expectations: Q2 2024

    The chart displays statistics on the earnings performance of various industries in the S&P 500 in Q2 2024.

    Most industries have a higher proportion of earnings exceeding expectations (green), but the communication services industry, consumer necessities, and non essential sectors have a higher proportion of earnings below expectations (red).

    More than 80% of companies in the healthcare, real estate, industrial, and financial industries reported earnings exceeding expectations.

    The healthcare industry has shown the most outstanding performance, with only 10% of companies experiencing lower than expected earnings.

    More than 20% of companies in the communication services and non essential consumer goods industries have lower than expected earnings.

    This means that there are significant differences in the degree to which a company’s profitability aligns with market expectations across different industries.

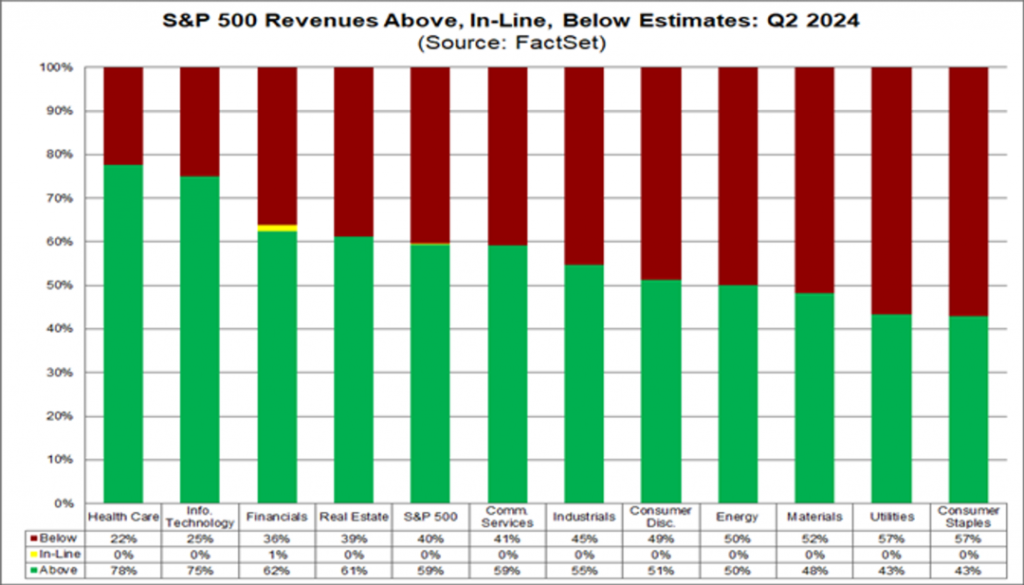
    Figure 2: S&P 500 Revenue Exceeded, Meets, and Underestimates: Q2 2024

    In terms of revenue, the chart shows that over half of the companies have lower than expected revenue in multiple industries (red). Especially in the fields of public utilities, materials, energy, and industry.

    The healthcare and information technology industries have performed well, with over 70% of companies exceeding their revenue expectations. Especially in information technology, the proportion reaches 78%.

    The revenue performance of the financial, real estate, communication services, and industrial industries is relatively mediocre, with 36% of companies in the financial industry having lower than expected revenue.

    In Q2 2024, the company faces significant challenges in generating revenue, particularly in traditional industries.

    The information technology and healthcare industries continue to lead the market, demonstrating strong revenue growth potential.

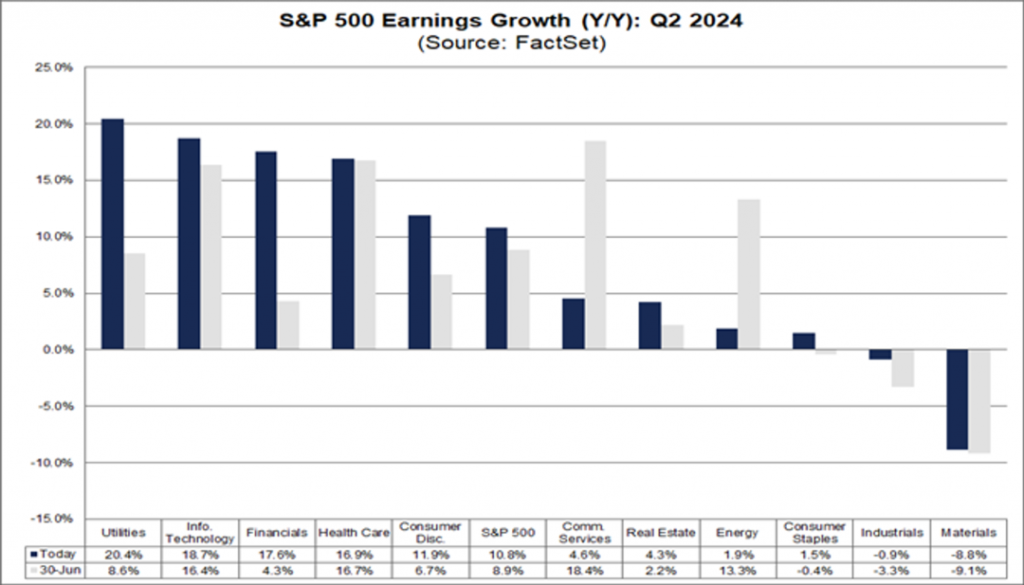
    Figure 3: S&P 500 Revenue Growth (YoY): Q2 2024

    The chart shows the year-on-year revenue growth rates of various industries in the S&P 500 for Q2 2024.

    The revenue growth rates of the public utilities and information technology industries are particularly prominent, at 20.4% and 18.7% respectively, demonstrating strong growth momentum.

    However, the materials and industrial industries experienced negative growth in revenue, with a 9.1% decline in the materials industry.

    These industries may have been affected by global demand slowdown, rising costs, and other factors, while the revenue growth of finance, healthcare, and consumer industries is relatively robust.

    The data shows that the overall economic environment in Q2 2024 has a significant impact on certain industries, especially those closely related to global supply chains and commodity prices. Meanwhile, industries such as technology and utilities continue to maintain strong growth.

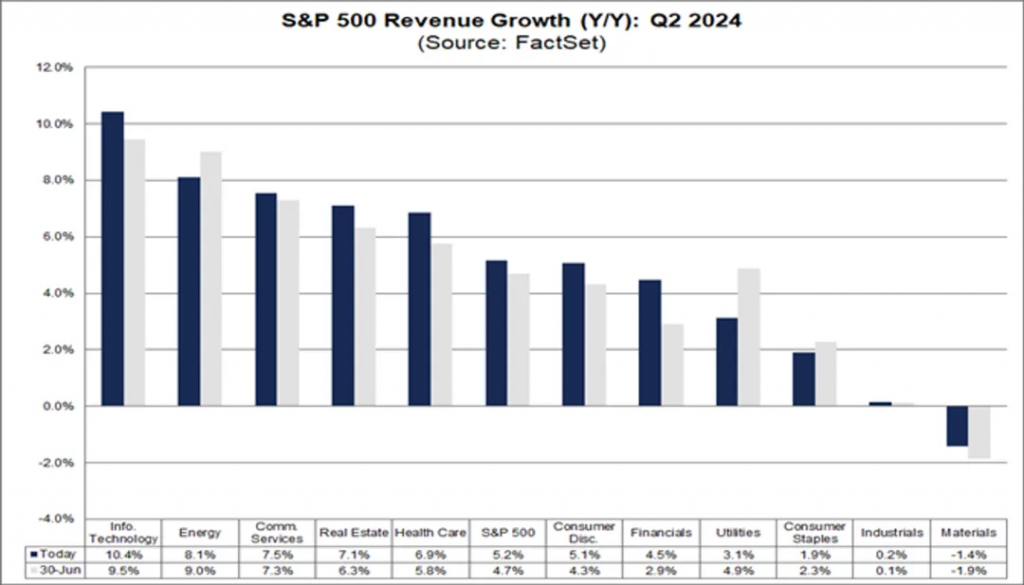
    Figure 4: S&P 500 Revenue Growth (YoY): Q2 2024

    The chart shows the year-on-year revenue growth rates of various industries in the S&P 500 for Q2 2024.

    The information technology and energy industries have the highest revenue growth rates, at 10.4% and 8.1% respectively, demonstrating their significant role in driving revenue growth.

    However, income in the industrial and materials industries has declined, especially in the materials sector. The chart shows that these industries are facing challenges in the current economic environment, such as weak demand and price pressures.

    The technology, energy, and communication services industries have shown strong growth trends, while the performance of the industrial and materials industries reflects greater uncertainty and challenges.

    Overall, the driving force for revenue growth in the second quarter of 2024 mainly comes from the rise in innovative technologies and energy demand.

    Through analysis, it can be seen that the overall profitability of S&P 500 companies in the second quarter of 2024 is strong, especially in industries such as technology and utilities. Despite the pressure faced by certain industries such as materials and industry, the overall market growth momentum remains robust.

    Investors can pay attention to potential opportunities in these growth driven industries.

    The global panic trading is coming to an end. Start at the low point and assess the situation accordingly.


    Disclaimer: The content of this article is for reference only and does not constitute investment advice. Investment carries risks, and caution is necessary when entering the market.

  • Weekly U.S. Stock Market Outlook: Will the Magnificent Seven Drive Nasdaq to New Heights? Key Points to Watch

    💡 The earnings season has entered an exciting week with major tech giants reporting their results!

    Next week, the market is expected to experience heightened volatility due to the upcoming Federal Reserve FOMC meeting, several key earnings reports from major tech companies, and the monthly employment report on Friday. Given that the stock market is currently in an overbought technical state, we may face risks from “news sell-offs” or downward adjustments following the earnings reports of large tech stocks. Therefore, the outlook for next week is “high volatility” with a slightly bearish bias overall. It’s important to note that February has historically been the worst month for tech stocks over the past 20 years. However, if the earnings reports and guidance from major tech firms are exceptionally strong, they could push the market higher and delay any potential tech stock correction.

    Last Week’s Market Review and Earnings Summary:

    Last week, the market continued to fluctuate at high levels, with the three major U.S. stock indices consolidating at high points. The Dow Jones and the S&P indices reached historic new highs, showing considerable strength.

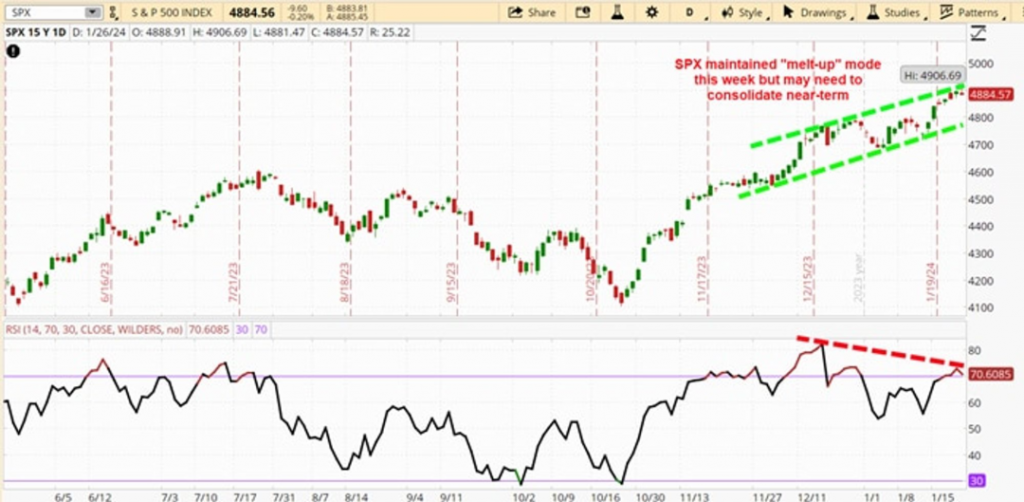
    From the weekly trend of the major indices, the Russell 2000 Index led with a weekly gain of 1.84%, followed by the S&P Index with a 1.06% increase, the Dow Jones with 0.65%, and the Nasdaq with 0.62% at the “bottom” among the indices. Last week, the strategist’s overall outlook for the market was “bullish,” and they pointed out the technical significance of the S&P 500 Index (SPX) breaking through historical highs. The SPX closed higher every day this week and set another historical high (intraday) at 4,906 today. Technology stocks continued to drive the bullish momentum this week, with the Nasdaq 100 Index (NDX) and the Philadelphia Semiconductor Index also reaching historical highs.

    Economic Data Level:

    Summarizing the data for the week, there was evidence of a strong U.S. economy and cooling price inflation, which supports the bullish argument that the U.S. economy is poised for a soft landing, as strategists have long been optimistic about. Yesterday, the Q4 GDP estimate came in at 3.3%, significantly higher than the economists’ expected 2.2%, driven by personal spending. In the GDP report, the core price index was at 2.0%, the lowest level since June 2020. Other evidence of deflationary trends in the Personal Consumption Expenditure Price Index (PCE) emerged. Although the overall and core PCE monthly data were in line [both at +0.2%, as expected, and the Federal Reserve’s preferred inflation indicator], the annual core PCE index slowed to 2.9% (from 3.2% in November, below the expected 3.0%), the lowest reading since March 2021.

    Elsewhere, the S&P Global U.S. Composite PMI rose to 52.3 in January from 50.9 in December, hitting a seven-month high and surpassing market expectations of 51.0. Also noteworthy in the report was that the business confidence index reached a 20-month high, and the price change index rose at the slowest pace since May 2020.

    In terms of labor, although the initial jobless claims were higher than expected (214K vs. 192K estimate), the 187K initial jobless claims from the previous week were the lowest since September 2022. The number of continuing claims for unemployment benefits rose slightly to 1.833M this week, above economists’ expectations of 1.828M. A reminder that we will receive the non-farm payroll data on Friday.

    From a weekly perspective, the yield on the 10-year U.S. Treasury note (TNX) fluctuated during the week but ended essentially flat compared to last Friday, currently at 4.143%. Chart-wise, as TNX approaches the 4.20% level this year, buyers seem to step in, so this could be a level to watch in relation to stocks. This means that if TNX breaks above the 4.20% level, it could challenge the comfort level of stock bulls and translate into some profit-taking in equities. Currently, Bloomberg sees about a 48% chance of a rate cut by the Federal Reserve in March, essentially flat compared to last Friday. However, if we go back two Fridays, that probability was at 82%, so the market seems to be tempering expectations for the Federal Reserve’s rate policy. This is not surprising, as expectations around the Federal Reserve’s rate cuts have been pushed further out over the past year. We will get a better understanding of the Federal Reserve’s stance at next week’s FOMC meeting.

    Core weekly earnings summary:

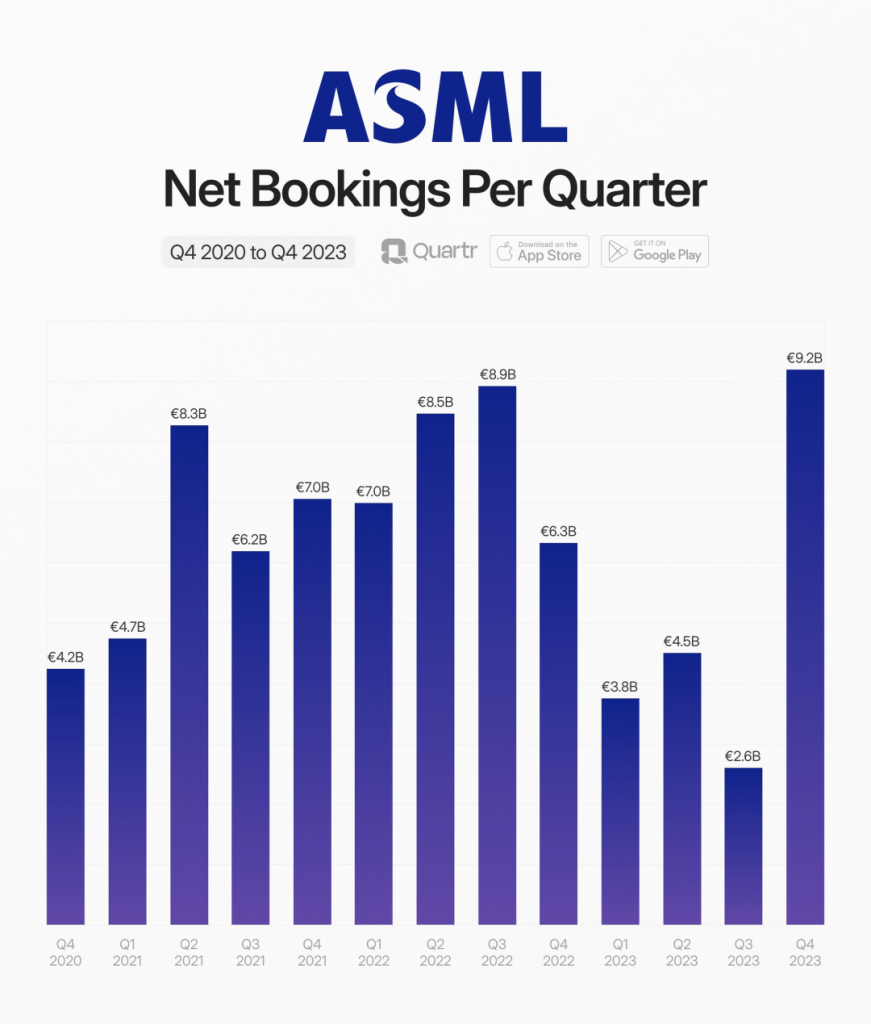
    1. Semiconductor giants: TSMC and ASML’s strong financial reports have driven semiconductor companies to surge continuously since the beginning of the year. Orders for financial reports continue to exceed expectations. Taking ASML, the mother of semiconductors, as an example, net bookings increased by +45%, +253% q/q, with memory at 47%, logic at 53%, and extreme ultraviolet light at 61%. This indicates that ASML’s high-end process expansion cycle has officially begun. In 2023, ASML’s stock performance lags behind Applied Materials, Lam Research, and KLA, but with the surge of AI in 2024 and the start of the 3nm expansion cycle, there is a strong optimism for ASML’s upward cycle.

    2. Consumer internet giant Netflix’s explosive new subscriptions have driven a collective surge among internet giants.

    3. Traditional software service providers like SAP and IBM have exceeded expectations with their performance, leading to a resurgence for these established companies.

    4. SaaS exemplar ServiceNow has also exceeded expectations in performance, driven by AI.

      Overall, the most frustrated giant of the week was undoubtedly Tesla, with its continuously declining gross margin, slowing sales, and even a direct omission of the 2024 sales outlook, leading investors to vote with their feet. The biggest highlight for Tesla in 2024 will be whether it can capture more market share after price reductions and expand its base of existing car owners to strive for more active users for the launch of FSD. In addition, some chip companies are struggling, such as TXN, INTC, and KLAC, so we need more data points to assess the Q4 earnings season for tech stocks. Investors won’t have to wait long, as we will receive reports from most of the “Magnificent 7” companies this week – Apple (AAPL), Amazon (AMZN), Alphabet (GOOG), Microsoft (MSFT), and Meta (META).

      Outlook for Next Week:

      With numerous earnings disclosures on the horizon, traders should prepare for potentially higher volatility next week. After a continuous surge, each giant will be tested by their performance, and even a slight miss could lead to significant market fluctuations. Additionally, this week will see the Federal Open Market Committee (FOMC) meeting, the release of several key large-cap tech stock earnings, and the monthly employment report on Friday. Coupled with the technically overbought stock market, I am concerned that we might be preparing for “sell the news” events in large-cap tech reports and/or consolidation declines. Therefore, the outlook for next week is “high volatility,” with the performance of the Magnificent Seven determining market trends.

      Key economic data for next week includes:

      • Tuesday (January 30th): Consumer Confidence Index, FHFA House Price Index, S&P Case-Shiller House Price Index
      • Wednesday (January 31st): ADP Employment Change, EIA Crude Oil Inventories, Employment Cost Index, FOMC Rate Decision, MBA Mortgage Applications Index
      • Thursday (February 1st): Construction Spending, Continuing Jobless Claims, Initial Jobless Claims, ISM Manufacturing Index, Productivity Preliminary, Unit Labor Cost Preliminary
      • Friday (February 2nd): Non-Farm Payrolls, Average Hourly Earnings, Unemployment Rate, Factory Orders, University of Michigan Consumer Sentiment Index – Final

      Earnings:

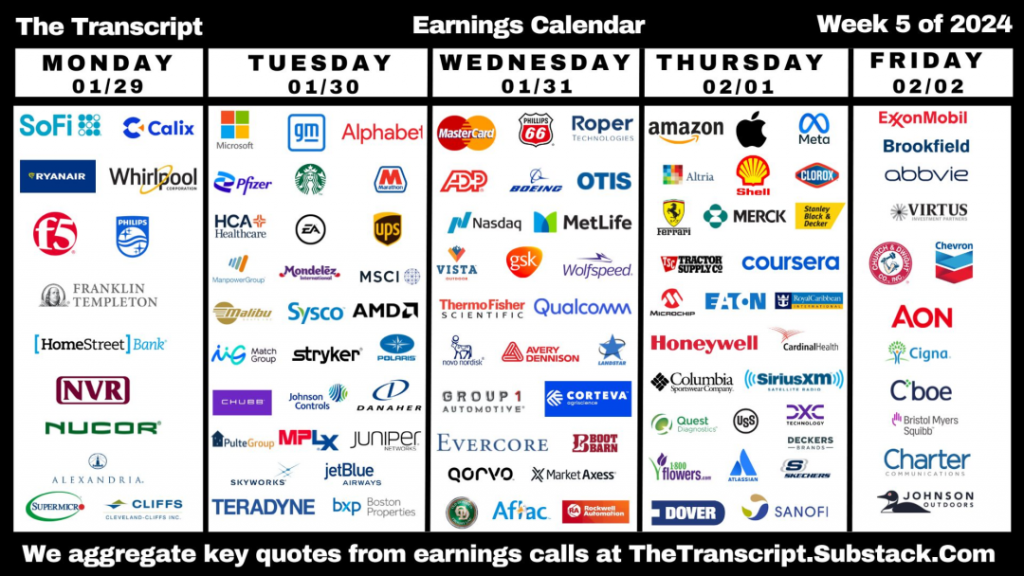
      • Monday (January 29th): Alexander Real Estate Equities, F5 Inc. (FFIV), Nucor Co. (NUE), Super Micro Computer (SMCI), Whirlpool Corp. (WHR)
      • Tuesday (January 30th): Microsoft Corp. (MSFT), Advanced Micro Devices Inc. (AMD), Alphabet Inc. (GOOG), Danaher Corp. (DHR), General Motors (GM), HCA Healthcare (HCA), Pfizer (PFE), Starbucks Corp. (SBUX), United Parcel Service (UPS)
      • Wednesday (January 31st): Aflac (AFL), Automatic Data Processing (ADP), Boeing Co. (BA), Mastercard (MA)
      • Thursday (February 1st): Amazon.com Inc. (AMZN), Apple Inc. (AAPL), Honeywell International (HON), Merck & Co. (MRK), Meta Platforms (META), Microchip Technology (MCHP)
      • Friday (February 2nd): AbbVie (ABBV), Bristol-Myers Squibb (BMY), Exxon Mobil (XOM), Chevron (CVX), Cigna (CI), Regeneron Pharmaceuticals (REGN)

      Key Focuses:

      $GM, $GOOG, $MA, $CDLX, $PHG, $ROP, $AMZN, $XOM, $MSFT, $META, $BAM, $WHR, $PFE, $ABT, $HON, $OTIS, $MO, $CLX, $ABBV, $BA, $SHEL, $HCA, $EA, $UPS, $NDAQ, $MET, $MRK, $DECK, $VIRT, $RACE, $CVX, $MDLZ, $MSCI, $V, $GSK, $WLF, $COUR, $BEN, $TEAP, $MBUU, $SYY, $AMD, $TMO, $QCOM

      Key Points of Interest:

      1. How much can AMD’s expected sales of AI chips in the data center be increased? Is Keybanc’s $8 billion target for 2024 possible?
      2. Where is the cycle of the entire cloud computing industry, and what is the situation with cloud optimization? Is cloud optimization over?
      3. Did the cloud growth rates of several major manufacturers show an upward inflection point this quarter, and what is the outlook for capex in 2024? These will be more specifically outlined in the earnings reports.
      4. The progress of AI across major companies, such as Microsoft’s AI Azure, AI Copilot revenue outlook, Google’s Performance Max revenue outlook, and other tech giants including Atlassian’s AI progress.

      Technical Review:

      This week, the S&P 500 Index reached a historical high of 4,909 points. Historical highs can be a bullish event as they can trigger short covering and attract funds from the sidelines, which was the case this week. However, with the RSI above 70, we seem to be stretched in the short term. Alternatively, if you draw a recent uptrend channel for the index, you can see that we are at the ceiling of the channel, indicating that we may need some consolidation. Therefore, if the SPX should at best pause (sideways consolidation period), or possibly need to pull back and digest some of the recent gains. Near-term technical outlook: slightly bearish.

      Source: ThinkorSwim trading platform. Past performance does not guarantee future results.

      Nasdaq 100 Index:

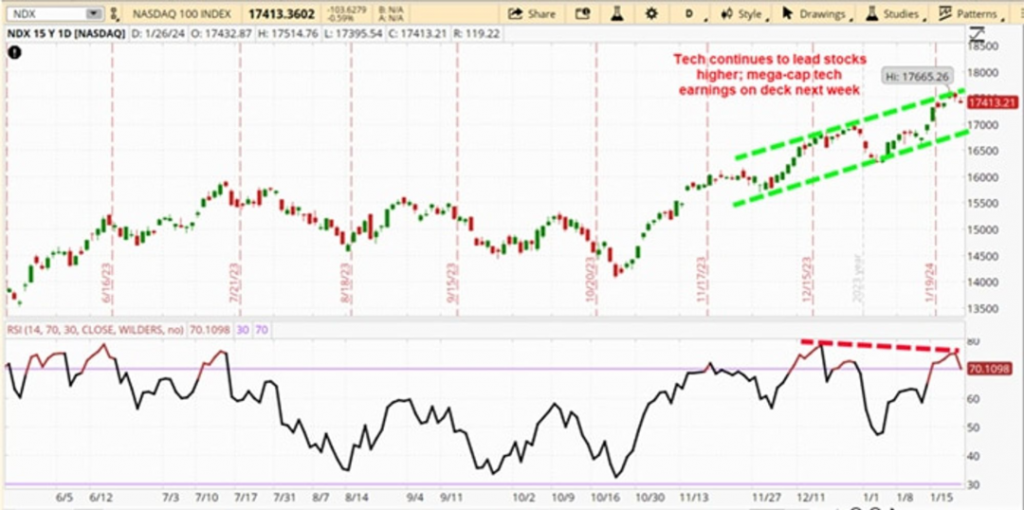
      Like the SPX, the Nasdaq 100 Index reached a historical high this week. The influx of funds into tech stocks is evident, but we are still technically overbought, with a negative divergence in the RSI indicator. A negative divergence in the RSI may indicate that the trend is changing, and uptrends are usually resolved by sideways consolidation or pulling back. Can large-cap tech stocks achieve earnings next week and push the NDX to new heights? Of course, it is possible. However, with MSFT, AMZN, GOOG, and META all trading at historical highs or 52-week highs, the situation is not good. This setup could lead to a “sell the news” reaction, regardless of what they report (i.e., good news is already priced in). Furthermore, as we enter February, seasonal factors favor bears, as it is the month when the Nasdaq Index has performed the worst over the past 20 years. I may have called for some sort of technical correction before next week early, but at least I am preparing for this possibility, just in case it does not manifest as quickly as anticipated. Near-term technical outlook: bearish.

      Source: ThinkorSwim trading platform. Past performance does not guarantee future results.

      Market Breadth:

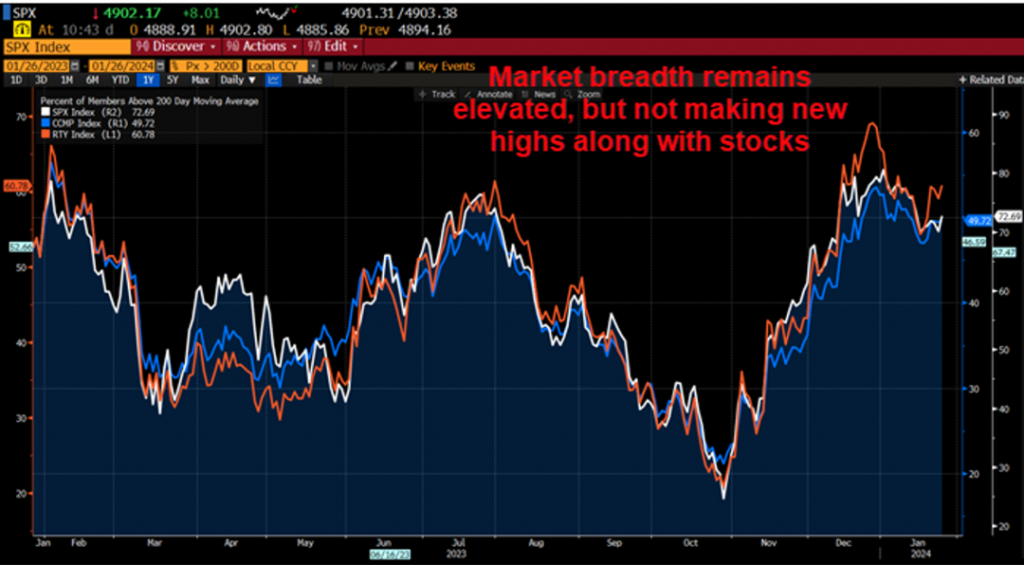
      Below is a Bloomberg chart showing the current percentage of stocks trading above their respective 200-day simple moving averages in the S&P 500 Index, Nasdaq Composite Index, and Russell 2000 Index. Market breadth improved/increased this week but has retreated from its highs at the end of November/beginning of December. As the SPX, DJI, and NDX reached historical highs this week, ideally, market breadth would reach new cyclical highs along with the indices, but that has not been the case. Compared to last Friday, the SPX (white line) width increased from 70.68% to 72.69%, COMPX (blue line) from 47.02% to 49.72%, and RUT (red line) from 54.93% to 60.78%.

      Market breadth attempts to capture the participation of individual stocks within the overall index, which helps to convey the potential strength or weakness of trends or movements. Generally, broader participation indicates healthy investor sentiment and technical support. There are numerous data points that can help convey market breadth, such as the ratio of advancing to declining issues, the percentage of stocks in an index that are above or below their long-term moving averages, or the number of new highs and new lows.

    1. The Battle of Large Models: GPT-40 Takes the Lead, Who Will Be the Next Dominant Force in the AI World?

      Who is the most powerful model? How should it be judged?

      From the Thousand-Group Battle to the Battle of Sharing, and now to the current battle of large models, the Hundred-Model War is unfolding in full swing, with each side holding their own opinions.

      Today, I will combine data from third-party platforms to rank the currently popular large models based on five major dimensions of capabilities: comparing and analyzing AI models on key performance indicators (including quality, price, output speed, latency, context window, etc.).

      Here are the highlights of the six key indicators:

      1. Quality Index: Used to evaluate the performance of models in various tasks and benchmark tests, a higher score indicates better model performance.
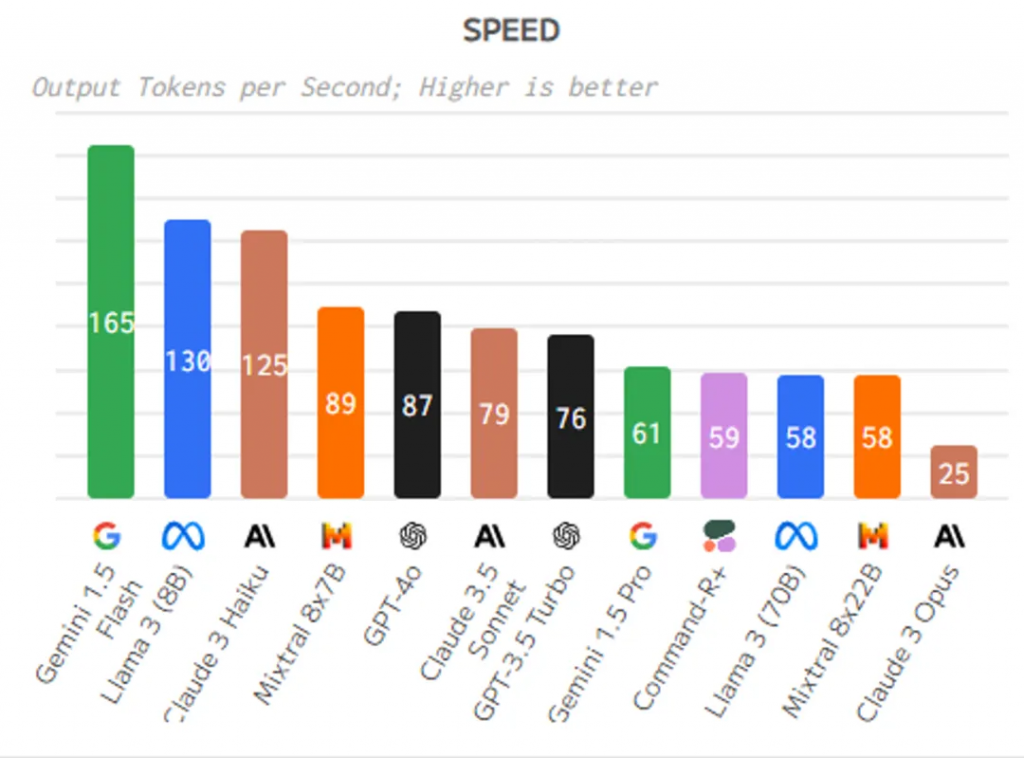
      2. Output Speed: Measures the speed at which the model generates output; a higher output speed indicates stronger processing capabilities.
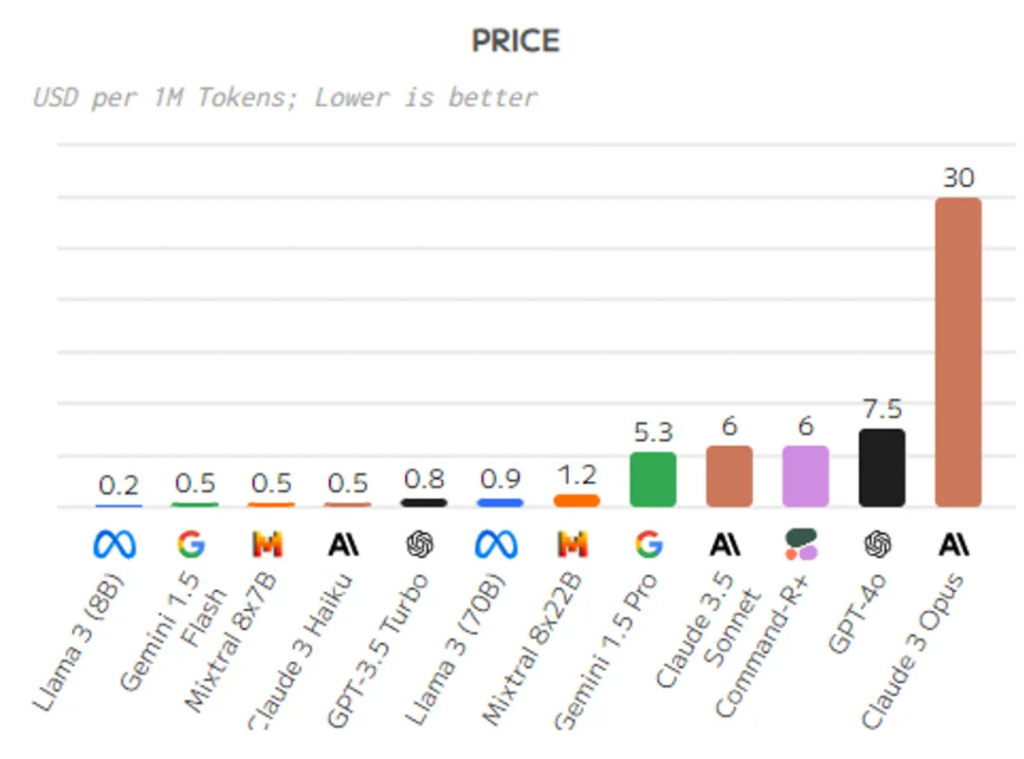
      3. Price: Represents the cost of the model; a lower price indicates higher cost-effectiveness.
      4. Latency: Refers to the time interval between sending a request and receiving the first response; lower latency indicates faster model response.
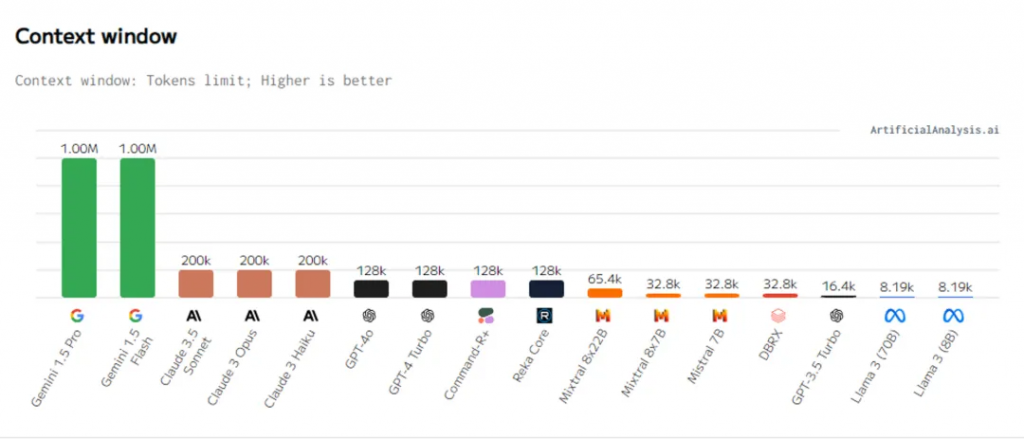
      5. Context Window: Indicates the limit on the number of tokens the model can consider when processing text; a larger context window helps the model better understand and generate text.
      6. Total Response Time: The time elapsed from sending a request to receiving the complete output result, taking into account factors such as latency and output speed.

      These key indicators can help users comprehensively evaluate and compare the performance and characteristics of different AI models, thereby selecting the model that best suits specific task requirements.

      • The higher the quality index, the better. There is a trade-off between quality, output speed, and price. The quality index represents the relative performance in the field of chatbots, MMLU, and MT-Bench.
      • The speed metric represents the number of tokens generated per second during model inference.
      • The price metric represents the cost per million tokens. There are speed differences between models, and quality and price do not necessarily correlate.
      • The total response time represents the time required to receive output for 100 tokens, calculated based on latency and output speed metrics.
      • The latency metric represents the time required to receive the first token. The total response time varies with the increase in input token length. There is a trade-off between speed and price, and a relationship between latency and output speed.
      • The total response time varies with the increase in input token length. There are speed differences between models. The total response time represents the time required to receive output for 100 tokens. There are differences in total response time between models.

      The ranking of AI models based on different metrics is as follows:

      First, Quality Index:

      The higher the score, the better. The quality index of large AI models is usually evaluated based on their performance in various benchmark tests and tasks. A higher quality index score indicates better performance in all aspects. These performance metrics may include accuracy, fluency, logic, etc., in tasks such as natural language processing, text generation, dialogue systems, etc. A higher quality index means the model performs better in various tasks. When choosing to use large models, the quality index is an important reference metric that can help users evaluate the overall performance and suitability of the model.

      • GPT-4o
      • Claude 3.5 Sonnet
      • Gemini 1.5 Pro
      • GPT-4 Turbo
      • Claude 3 Opus
      • Gemini 1.5 Flash
      • Llama 3 (70B)
      • Command-R+
      • Claude 3 Haiku
      • Mixtral 8x22B
      • Llama 3 (8B)
      • Mixtral 8x7B
      • GPT-3.5 Turbo

      Second, output speed:

      The output speed of large AI models is usually influenced by multiple factors, including the complexity of the model, the number of parameters, computational resources, and the level of optimization. Generally speaking, large models with more parameters and complex computation processes may have slower output speeds. Larger models typically require more computational resources and time to process input data and generate output, thus their output speed may be somewhat affected. However, some large models may improve output speed through optimization algorithms, parallel computing, and other technologies to enhance performance and efficiency. In practical applications, it is necessary to consider factors such as the model’s output speed, accuracy, and latency comprehensively in order to select the model that best suits the specific task.

      • Gemini 1.5 Flash
      • Llama 3 (8B)
      • Claude 3 Haiku
      • Mistral 7B
      • Mixtral 8x7B
      • GPT-4o
      • Claude 3.5 Sonnet
      • GPT-3.5 Turbo

      Third, large model token pricing:

      The price of large AI models is usually influenced by multiple factors, including the complexity of the model, the number of parameters, training costs, computational resources, and more. Large models typically require more computational resources and time for training and deployment, hence their prices may be higher. Additionally, some large models may require specialized hardware devices or cloud computing services to support their operation, which can also increase costs. When choosing to use large models, it is important to consider a balance between price and performance to ensure cost control while meeting requirements. Different providers and services may have varying pricing strategies and models, so a comprehensive evaluation and comparison are necessary when selecting large models.

      • Llama 3 (8B)
      • Gemini 1.5 Flash
      • Mixtral 8x7B
      • Claude 3 Haiku
      • GPT-3.5 Turbo
      • Llama 3 (70B)
      • Mixtral 8x22B
      • GPT-4 Turbo
      • Claude 3 Opus

      Fourth, large-scale model context window:

      The context window refers to the limit on the number of tokens that a model can consider simultaneously when processing text in natural language processing. In other words, the context window represents the range of the length of the input text that the model can see when generating output. A larger context window means that the model can take into account more contextual information, thus better understanding and generating text. In certain tasks such as information retrieval and reasoning, a larger context window may lead to better performance. Therefore, the context window is one of the important indicators for evaluating the capability and performance of a model.

      • Gemini 1.5 Pro
      • Gemini 1.5 Flash
      • Claude 3.5 Sonnet
      • Claude 3 Opus
      • Claude 3 Haiku
      • GPT-4o
      • GPT-4 Turbo
      • Command-R+
      • Reka Core

      Fifth, total response time:

      The total response time of large AI models is usually influenced by multiple factors, including the complexity of the model, the number of parameters, computational resources, input data size, and more. Total response time refers to the time it takes from sending a request to receiving the complete output result. For large models, due to their complexity and high computational requirements, the total response time may be longer. However, some large models may reduce the total response time through optimization algorithms, parallel computing, and other technologies to improve performance and efficiency. In practical applications, it is necessary to comprehensively consider factors such as the total response time, accuracy, and latency of the model in order to choose the model that best suits the specific task.

      • Llama 3 (8B)
      • Mistral 7B
      • Claude 3 Haiku
      • Gemini 1.5 Flash
      • GPT-3.5 Turbo
      • Mixtral 8x7B
      • GPT-4o
      • Claude 3.5 Sonnet

      Sixth, Delay Sorting:

      Furthermore, sorting AI models based on delay (in seconds) is as follows: Large AI models typically have higher delays because these models need to process more parameters and more complex calculations. Large models usually require more computational resources and time to process input data and generate output. Therefore, compared to small models, the delay of large models may be longer. However, some large models may reduce delays through optimization and parallel processing technologies to improve performance and efficiency. When choosing to use large models, it is necessary to balance the relationship between performance and delay to meet the specific requirements of the application.

      1. Mistral 7B
      2. Mixtral 8x22B
      3. Llama 3 (8B)
      4. Mixtral 8x7B
      5. GPT-3.5 Turbo
      6. Command-R+
      7. Llama 3 (70B)
      8. DBRX
      9. GPT-4o
      10. Claude 3 Haiku
      11. GPT-4 Turbo
      12. Claude 3.5 Sonnet
      13. Gemini 1.5 Pro
      14. Gemini 1.5 Flash
      15. Reka Core
      16. Claude 3 Opus

      ======================================


      According to the ranking based on different indicators, we can have a clearer understanding of the performance of various AI models on key performance metrics.

      Based on the ranking results, the highlights of the six key indicators can be summarized as follows:

      1. Quality Index: GPT-4o and Claude 3.5 Sonnet perform the best in terms of quality index, scoring high and demonstrating outstanding performance in various tasks and benchmark tests.
      2. Output Speed: Gemini 1.5 Flash and Llama 3 (8B) excel in output speed, showing high processing power and speed.
      3. Price: Llama 3 (8B) and Gemini 1.5 Flash perform well in terms of price, offering lower prices and higher cost-effectiveness.
      4. Latency: Mistral 7B and Mixtral 8x22B perform well in terms of latency, with fast response times.
      5. Context Window: Gemini 1.5 Pro and Gemini 1.5 Flash have larger context windows, which help the models better understand and generate text.
      6. Total Response Time: Llama 3 (8B) and Mistral 7B stand out in total response time, being able to quickly generate complete output results.

      In conclusion, users can choose the most suitable AI model based on specific needs and key indicators of interest. This concludes the entire text.

    2. Translation: 【Investing in US Stock ETFs】Dumping Apple and Snowflake, does Buffett’s selling mean that US stocks are no longer worth buying?

      “ Selling off Apple, snowflake, Buffett keeps hoarding cash, can we still play in the U.S. stock market?”

      Recently, Warren Buffett’s large-scale selling of stocks and hoarding of a significant amount of cash and bonds has attracted widespread attention. This move not only reminds people of his actions in the 1970s and before the 2008 financial crisis but also raises concerns about future economic recession, and even the possibility of a major economic crisis.

      Historically, Warren Buffett’s two classic stock selling behaviors occurred in the early 1970s and before the 2008 financial crisis. In both instances, Buffett chose to liquidate or significantly reduce his stock holdings due to the market being overvalued, rather than predicting an impending crisis. In fact, Buffett’s investment principles have always been based on the simple yet effective idea of “not buying overpriced stocks.”

      01

      Buffett selling off, U.S. stocks fluctuating

      Clearance operation in the 1970s:

      In 1969, Buffett believed that stocks in the market were generally overvalued and he couldn’t find suitable investment targets, so he decided to clear out his stock holdings and close his investment company. Despite the bull markets in 1970 and 1972, he chose not to participate until re-entering the market after the major market crash in 1973. This operation proved his emphasis on valuation rather than predicting short-term market fluctuations.

      High cash holdings before the 2008 financial crisis:

      Similarly, in the mid-2000s, Buffett began significantly reducing his stock holdings and hoarding cash for the same reason of not finding reasonably valued investment opportunities. Although Buffett’s performance lagged behind the market in those years, he successfully bottomed out after the 2008 financial crisis, proving that his decision to hold a large amount of cash years earlier was wise.

      Current market operations:

      Today, Buffett is once again adopting a similar strategy, selling off a large amount of U.S. stocks and accumulating a huge amount of cash. This indicates that he may believe the current market valuation is too high and lacks sufficiently attractive investment opportunities, rather than simply being based on concerns about short-term economic crises. Buffett’s actions reflect his consistent investment logic: in overvalued markets, he would rather hold cash than take risks by buying overvalued stocks.

      Looking at Buffett’s past operations, he does not rely on complex market predictions, but adheres to simple yet effective investment principles. While this approach is simple, executing it requires great patience and discipline. For ordinary investors, although it is difficult to fully replicate Buffett’s operations, his emphasis on market valuation and the principle of maintaining patience in investing are undoubtedly worth learning from.

      In the current market, Buffett’s actions may indicate that market valuations are already high and risks are accumulating. However, whether to follow Buffett in selling stocks or not, everyone needs to make decisions based on their own investment goals and patience. As Buffett said, the key to successful investing lies in avoiding overvalued stocks and maintaining sufficient funds and patience when opportunities arise.

      02

      Can I still invest in the US stock market?

      When Warren Buffett starts selling off his long-held stocks such as Apple and Snowflake in large quantities and hoarding cash, investors naturally feel uneasy. Does this series of actions mean that the US stock market is about to face significant risks, or even a dilemma of being difficult to continue investing in? We need to analyze this issue from multiple perspectives.

      1. What does Buffett’s behavior mean?

      Buffett’s sale of Apple and Snowflake stocks is not the first time. In fact, he has reduced his holdings of these stocks in the past, but this does not necessarily mean that he has lost confidence in the long-term prospects of these companies. More often, this is based on considerations of portfolio management, risk control, and seeking other investment opportunities. At the same time, hoarding cash indicates that Buffett may believe that the overall market valuation is too high, or there is a lack of attractive investment targets, hence choosing to temporarily hold cash. Buffett’s strategy is usually based on long-term considerations and does not entirely reflect short-term market trends. Therefore, his actions are more defensive in nature rather than a clear prediction of an imminent market crash.

      1. Can we still play in the US stock market?

      Whether one can continue to invest in the US stock market should not be judged solely based on Buffett’s actions. Although Buffett has reduced some tech stocks, it does not mean that the entire market has lost investment value. On the contrary, there are still many companies with growth potential in the market. Investors should consider the following aspects:

      • Industry and stock selection: In the current market environment, although overall valuations are high, certain industries (such as technology, green energy, artificial intelligence) still have significant growth potential. Investors can choose industries and stocks with long-term growth potential, rather than just following the market trend.
      • Market volatility and investment opportunities: Market volatility may increase, but for prepared investors, this is also a good time to find undervalued opportunities. Even in a bear market, some companies may perform well, so staying attentive and flexibly adjusting the investment portfolio is crucial.
      • Asset allocation and risk management: Investors can reduce single-market or industry risks through diversified investments and proper asset allocation. Holding a moderate amount of cash can also help cope with market fluctuations and enter the market at the right time.

      3. Is Buffett’s action a warning?

      Buffett’s actions have undoubtedly raised concerns about market valuations. However, short-term market trends are not solely driven by valuations, but also influenced by factors such as liquidity, policies, and corporate profit expectations. Buffett’s strategy is more of a defensive arrangement, reminding investors to remain cautious when the market is at a high level.

      For ordinary investors, the key is not to blindly follow the crowd, but to make moderate adjustments based on their own risk tolerance and investment goals. There are still many opportunities in the market, but it requires careful selection to avoid chasing high prices and unreasonable risk exposure.

      Although Buffett’s selling behavior has raised concerns about the U.S. stock market, it does not mean that U.S. stocks are no longer worth investing in. Opportunities still exist in the market, and the key is how investors identify these opportunities and manage risks rationally. Buffett’s strategy reminds us to stay calm and cautious in times of market overvaluation, while also emphasizing the importance of cash. However, each investor’s situation is different, and decisions should be based on their own investment goals and market understanding, rather than simply following in Buffett’s footsteps.

      03

      Interest rates have been cut, the economy is doing well, and there are still plenty of opportunities in the U.S. stock market.

      The recent return of optimism in the market can be attributed to four key aspects:

      1. Softening inflation data: Economic cooling rather than recession

      Inflation data for July came in below expectations, with year-on-year increases of 2.9% for CPI and 2.2% for PPI. Prices for categories such as food, clothing, new and used cars, and airfare showed monthly declines, indicating a slow easing of consumer prices. However, prices in the housing and rental sectors remain high, and the cost of motor vehicle insurance remains elevated. Although inflation in these areas is decreasing slowly, over time, these prices will gradually return to rational levels, further supporting the overall downward trend in inflation.

      The slowdown in inflation is significant for both the market and the Federal Reserve. For consumers, lower living costs help boost consumer willingness to spend, further stimulating economic activity. For the Fed, the cooling of inflation makes it more feasible to achieve the 2.0% PCE inflation target. Therefore, the further decline in inflation data in the coming months will be an important reference for the Fed to adjust its monetary policy, potentially prompting the start of an interest rate cut cycle.

      1. Better-than-expected economic data: Stable consumer spending and job market

      Despite concerns about economic recession due to the disappointing performance of the July non-farm payroll report, a series of recent economic data releases exceeding expectations have alleviated these concerns. For example, retail sales in July grew by 1%, well above the market’s expected 0.4%, and consumer sentiment index also surpassed expectations. Meanwhile, initial jobless claims have steadily declined in recent weeks, indicating that while the labor market has slowed down, it has not deteriorated sharply.

      The improvement in economic data indicates that although the U.S. economy is cooling, it remains on a healthy growth trajectory. The growth in retail sales demonstrates consumer resilience, which is crucial for the overall economy as consumer spending accounts for over 70% of the U.S. GDP. The decline in the unemployment rate suggests that despite a slowdown in the labor market, there is no widespread wave of unemployment. These data will further support the market’s expectation of a “soft landing,” where economic growth slows down but does not fall into recession.

      1. Fed policy path: Is an interest rate cut cycle about to begin?

      With the softening of inflation data and the improvement of economic indicators, market expectations for the Federal Reserve to initiate a rate-cutting cycle at the FOMC meeting on September 18 have been gradually strengthening. Although the market speculates that the Fed may cut rates by 50 basis points in one go, the current economic data does not suggest the need for such an aggressive monetary policy adjustment. Therefore, the Fed may opt for a more cautious approach, gradually adjusting its policy through small rate cuts.

      The Fed’s rate cuts will have far-reaching implications for the financial markets, especially given the current optimistic expectations for future economic growth. Lowering interest rates will not only reduce borrowing costs for businesses but also boost market sentiment, driving stock market gains. However, the Fed’s rate-cutting policy may also prompt some investors to reassess their asset allocation strategies, especially for high-risk, high-return growth assets. Therefore, the future direction of the Fed’s monetary policy will be a focal point for the market.

      4.Market Outlook: Diversified Leadership Pattern May Emerge

      Against the backdrop of slowing inflation and improving economic data, the market has recently experienced a significant rebound, especially in the technology and growth sectors. With the possibility of the Fed initiating an interest rate cut cycle, market leadership may expand from large-cap tech stocks to more industries such as industrials and utilities. Over the next 18 months, the diversification of market leadership may become a new theme, providing broader opportunities for investment portfolios.

      Historical experience indicates that when the Fed starts cutting rates and the economy achieves a soft landing, the market tends to perform well. Investors may diversify away from an over-concentration in tech stocks and shift towards other value and cyclical industries. Therefore, investors should focus on opportunities for diversified allocation in future market fluctuations, especially in industries benefiting from economic recovery and slowing inflation, such as industrials, utilities, and financials. As market uncertainties gradually diminish, a diversified investment strategy will help manage future risks and seize potential profit opportunities.

      Through an in-depth analysis of these four key points, it can be seen that the return of optimism in the current market has a solid foundation. With ongoing improvements in inflation data, stable economic growth, and reduced uncertainty in Fed policy, the market may enter a new cycle of recovery.

      In the current environment of imminent rate cuts and relatively stable economic conditions, the following types of ETFs may be worth considering:

      1. Large-Cap Value ETFs

      As the rate-cut cycle begins, a stable economic environment and lower interest rates can boost the performance of value stocks, especially those companies with robust profit capabilities and stable cash flows. These companies typically demonstrate strong resilience throughout economic cycles. Value ETFs such as Vanguard Value ETF (VTV) or iShares Russell 1000 Value ETF (IWD) may benefit from this trend.

      1. High Dividend ETFs

      In a low-interest-rate environment, investors often prefer assets that provide stable dividend returns, as these assets can offer relatively reliable income when rates are falling. High dividend ETFs such as Vanguard High Dividend Yield ETF (VYM) or iShares Select Dividend ETF (DVY) are worth considering.

      1. Real Estate Investment Trusts (REITs) ETFs

      Interest rate cuts typically benefit the real estate market, especially Real Estate Investment Trusts (REITs), as lower interest rates can reduce financing costs and increase property values. REITs ETFs such as Vanguard Real Estate ETF (VNQ) or Schwab US REIT ETF (SCHH) may perform well in a rate-cutting environment.

      1. Technology and Growth ETFs

      While value stocks may perform well in such an environment, technology and growth stocks may also continue to benefit with sustained economic growth, especially when lower financing costs are brought by interest rate cuts. Technology ETFs such as Invesco QQQ Trust (QQQ) or Vanguard Information Technology ETF (VGT) can continue to benefit from long-term growth trends.

      1. Cyclical Industry ETFs

      Stable economic growth typically drives the performance of cyclical industries such as industrial, financial, and materials sectors. The performance of these industries is closely tied to the economic cycle and tends to excel during economic expansions. Cyclical industry ETFs such as Industrial Select Sector SPDR Fund (XLI) or Financial Select Sector SPDR Fund (XLF) may be worth considering.

      With interest rate cuts on the horizon and a stable economic backdrop, investors may consider allocating to a mix of value, high dividend, REITs, technology and growth, and cyclical industry ETFs. These assets not only offer potential returns during rate cuts but also stand to benefit in an environment of stable economic growth.

      End of text.

    3. Unveiling the Current U.S. Economy and Stock Market: How to Seize Investment Opportunities?

      “The secret of the stock market rebound: Who is driving the growth?”

      After experiencing a nearly 10% correction in early August, the U.S. stock market has rebounded strongly. What is driving this recovery?

      • The power of sustained economic expansion: Despite global economic uncertainties, the U.S. economy continues to expand. Second-quarter GDP growth has been revised up to 3.0%, indicating strong consumer demand and economic activity, providing solid support for the market.
      • Surprises in corporate earnings: Second-quarter financial reports show that 80% of S&P 500 companies have exceeded expectations, with overall profit growth reaching 11.4%. This indicates robust growth in corporate profits, injecting momentum into the stock market.
      • The shift in Federal Reserve policy: The Fed is preparing to start a rate-cutting cycle, with market expectations for the first rate cut to be announced in September. This policy shift has eased concerns about liquidity tightening in the market and boosted confidence in the stock market.

      Challenges for tech stocks and the rise of new market favorites

      Tech giants have long led the market but are now facing dual challenges:

      • Pressure from high expectations: Taking NVIDIA as an example, despite strong growth, the market has set high expectations, with high valuations acting as a barrier.
      • The rise of new market favorites: With profit recoveries in other industries, sectors such as finance, healthcare, and utilities are performing well, leading to a shift in market leadership.

      01

      The Driving Forces Behind the Strong Recovery of the Stock Market

      1. The Driving Forces Behind the Strong Recovery of the Stock Market

      Since the nearly 10% correction in early August, the U.S. stock market has shown a strong rebound. Key factors supporting this recovery include:

      • Sustained economic expansion: Despite facing global economic uncertainties, the U.S. economy continues to show expansion momentum. The GDP growth for the second quarter was revised up to 3.0%, indicating strong consumer demand and continued economic activity. This provides a solid fundamental support for the market.
      • Corporate profit growth: During the second quarter earnings season, 80% of S&P 500 companies exceeded analyst expectations, with overall profit growth reaching 11.4%. This indicates that despite challenges in the market, corporate profits continue to grow steadily, providing momentum for the stock market.
      • Fed policy shift: After multiple rate hikes, the Fed is now preparing to start a multi-year rate-cutting cycle. The market expects the Fed to announce the first rate cut at the September meeting and gradually lower rates over the next few years. This policy shift alleviates concerns about liquidity tightening in the market and helps boost confidence in the stock market.
      1. The Dual Challenges Faced by Tech Stocks and the Shift in Market Leadership

      Tech stocks, especially the tech giants with massive market capitalization, have been leading the market in recent years. However, these tech giants are currently facing dual challenges:

      • Pressure from high expectations: Tech stocks represented by NVIDIA continue to show strong growth, but due to excessively high market expectations, their latest earnings report failed to bring enough surprises. In this scenario, high valuations have become a resistance to further upward movement for tech stocks.
      • Shift in market leadership: Meanwhile, as profits in other industries recover, market leadership is beginning to shift from a few tech giants to more diversified sectors. Sectors such as finance, healthcare, and utilities have shown significant performance, indicating that the foundation of the market rally is expanding, with more companies contributing to earnings.
      1. The Relationship Between Fed Policy and Future Markets

      The Fed’s policy shift is one of the key driving factors in the current market:

      • Inflation slowdown and rate-cutting cycle: With inflation nearing the 2% target, the Fed is transitioning from a stance of inflation suppression to supporting economic growth. Historical data shows that when the economy is not in recession, the initiation of a rate-cutting cycle typically has a positive impact on the stock market, which is also being reflected in the market currently.
      • Policy Risks and Market Expectations: While the Fed’s rate-cutting policy may benefit the stock market, caution is still needed regarding potential risks in policy implementation. The Fed has made mistakes in policy adjustments in its history, and whether the current rate-cutting cycle can progress as smoothly as expected by the market will have a significant impact on future market trends.

      4. Potential Risks and Challenges for the Future Market

      Despite the strong performance of the stock market in August, the next two months may face more challenges:

      • Seasonal fluctuations: Historically, September to October is usually a period of significant market volatility. With the approaching election day in November, political uncertainty may further exacerbate market volatility.
      • Variables in macroeconomic data: Despite the current strong momentum of economic expansion, any unexpected downturn in economic data (such as weak employment or consumption data) could reignite market concerns about economic slowdown or recession, thereby putting pressure on the stock market.
      • Market sentiment and investor behavior: Market sentiment remains fragile against the backdrop of current high valuations. While rate-cut expectations support the market, if future corporate earnings fail to maintain the current growth levels, or if the macroeconomic environment deteriorates, the market may experience significant pullbacks again.

      The current resilience of the U.S. economy, coupled with a strong recovery of the stock market after adjustments, and the upcoming rate-cutting cycle by the Fed, further boost market confidence. However, the pressure faced by tech giants due to high expectations and the shift in market leadership suggest that market structure is undergoing changes. The seasonal fluctuations and political uncertainty in the next two months, along with potential risks in the Fed’s policy implementation, may bring new challenges to the market. We should remain vigilant, monitor changes in macroeconomic data, and be prepared to deal with market volatility.

      02

      The focus is on what to pay attention to next?

      In the current market environment, I believe investors should pay attention to the following potential opportunities to cope with possible market fluctuations and seize growth opportunities:

      1. Focus on cyclical and value stocks

      As market leadership shifts from a few tech giants to a broader range of sectors, cyclical and value stocks may become new growth areas. Here are a few sectors worth watching:

      • Financial sector: With changes in interest rates, financial institutions such as banks and insurance companies may benefit. Especially if the Fed starts cutting rates, this could boost banks’ net interest margins and help increase loan demand.
      • Industrial and materials sector: Against the backdrop of economic expansion, industrial and materials companies typically perform well, especially driven by infrastructure construction and global economic recovery. These companies may benefit from government spending and the recovery of global supply chains.
      • Healthcare sector: Healthcare companies usually perform well during economic uncertainty, especially those providing essential medical services. In the current increased market volatility, the healthcare sector may serve as a relatively safe haven.
      1. Utilize short-term opportunities from market volatility

      Seasonal market fluctuations and potential policy changes may bring short-term trading opportunities. Here are some strategies:

      • Buy on dips: Buying quality stocks or sectors on market pullbacks can yield substantial returns. Especially during market volatility, if tech giants or other undervalued quality companies see a decline in stock prices, it may be a good time to enter these companies.
      • Volatility trading: If market volatility increases, trading with volatility derivatives (such as VIX options) can be profitable. Additionally, consider using option strategies (such as protective put options) to hedge risks in existing investment portfolios during high volatility.
      1. Focus on sectors and companies with strong revenue growth

      As profit growth expands beyond tech giants to other sectors, investors should focus on companies and sectors showing strong revenue growth potential:

      • Non-giant companies in the tech sector: Despite pressure on tech giants, some mid-sized tech companies may still have significant growth potential, especially those with a competitive advantage in cloud computing, cybersecurity, and AI.
      • New energy and clean energy: With the global transition to renewable energy, new energy and clean energy companies may benefit. These companies not only benefit from policy support but also from long-term growth trends.
      • Consumer goods and essentials: During increased economic uncertainty, consumer essentials and fast-moving consumer goods companies typically demonstrate stability. These companies often have stable cash flows and strong risk resistance capabilities.

      4. Paying attention to the Federal Reserve policies and macroeconomic data

      The direction of the Federal Reserve’s policies will directly impact market sentiment and asset prices, especially in the upcoming rate-cutting cycle. Here are key factors to watch:

      • Interest rate decisions and statements: Pay attention to the Federal Reserve’s interest rate decisions and policy statements in future meetings, especially the pace and magnitude of rate cuts. This will directly affect bond yields, stock valuations, and overall market sentiment.
      • Macroeconomic data: Particularly focus on employment data, inflation data, and consumption data. These data not only influence the Federal Reserve’s policy path but may also reflect the true health of the economy, thereby affecting market performance.
      1. Global diversification and hedging strategies

      As the U.S. market may face seasonal volatility and political uncertainty, global diversified investments can help diversify risks and capture growth opportunities in international markets:

      • International markets: Focus on investment opportunities in other developed markets and emerging markets, especially against the backdrop of loose monetary policy and accelerating economic recovery. The consumption growth and digital transformation in emerging markets also provide long-term investment opportunities.
      • Hedging strategies: Consider incorporating hedging tools such as gold, government bonds, or safe-haven currencies into the investment portfolio to protect it in times of market volatility or risk events.

      In the current market environment, investors should be flexible by focusing on cyclical and value stocks, utilizing market fluctuations, seeking companies with strong revenue growth, and closely monitoring Federal Reserve policies and macroeconomic data to identify opportunities. Additionally, global diversification and hedging strategies should also be part of the investment portfolio to address potential market volatility and uncertainty.

      End of text.

      Disclaimer: The content of this article is for reference only and does not constitute investment advice. Investment involves risks, so caution is advised when entering the market.

    4. I heard that you can buy U.S. Treasury bonds and retire early?

      First, US Treasury yields have dropped to record highs, with the 5% ten-year US Treasury bond making its debut.

      In the past week, with “buy US bonds for retirement” becoming a hot topic on social media, many friends have come to ask the financial expert if this is true.

      The fact is, it is true!!!

      Recently, US Treasury yields have surged to 5%, particularly for long-term bonds such as the 10-year, 20-year, and 30-year bonds. The interest rates for newly issued long-term US bonds have all soared to 5%. If one can buy US bonds recently and hold them until maturity, they can indeed earn an annual interest rate of 5%.

      Recently, with strong economic data, US Treasury yields have risen across the board, with the ten-year US Treasury yield approaching 5%, marking a new high in many years.

      On October 12, 2023, the surprising results of the 30-year U.S. Treasury bond auction in the United States forced primary dealers to take on 18.2% of the bonds that were not bought by other bidders, far exceeding expectations. The highest yield reached 4.837%, 50 basis points higher than expected. Long-term bond yields surged, causing concerns in the market about the sharp expansion of debt supply, attributed to reasons such as central bank selling, declining overseas demand, and reduced leverage buyers. Debt supply is expected to continue expanding, potentially impacting market liquidity.

      A 5% yield on U.S. bonds has raised three issues:

      1. For the public, holding these 5% U.S. bonds is simply too comfortable!!!

      For the public, a 5% yield on U.S. bonds is quite substantial. This means that if one invests $1 million, they can earn $50,000 in annual returns. This income can be used for retirement, education, and other expenses.

      Of course, U.S. bonds also come with risks. If the U.S. economy experiences a recession, the price of U.S. bonds may decline. Therefore, individuals need to be mindful of the risks when investing in U.S. bonds.

      1. For funds, the annual benchmark must prove it can outperform the 5% yield on the 10-year U.S. bonds, otherwise, why not just buy U.S. bonds?

      For funds, the annual benchmark must demonstrate it can outperform the 5% yield on the 10-year U.S. bonds. Otherwise, investors could directly purchase U.S. bonds for higher returns. Funds need to continuously strive to improve their investment returns to attract investors.

      1. For value stocks, does dividend yield outperform the 10-year U.S. Treasury yield?

      The pressure on value stocks has increased, balancing issues of dividend yield, growth, and debt levels. However, in the short term, it may exacerbate selling pressure on value stocks, as seen recently with significant selling pressure on stocks like Coca-Cola.

      Secondly, when it comes to buying and selling US Treasury bonds, there are certain issues to be aware of. The notion of “buying US bonds for retirement” has its merits, but it also carries certain risks.

      From the perspective of investment returns, US Treasury bonds have the following advantages:

      • High security: US Treasury bonds are issued by the US government and have a high credit rating.
      • Good liquidity: The US Treasury bond market is vast, ensuring ample liquidity.
      • High yield: Currently, US Treasury bond yields are at historical highs, offering a high investment return.

      Therefore, US Treasury bonds can serve as an investment tool for retirement planning, providing investors with stable cash flow and a relatively high yield.

      However, investing in US Treasury bonds also comes with the following risks:

      • Interest Rate Risk: An increase in US Treasury bond yields will lead to a decrease in US Treasury bond prices.
      • Inflation Risk: A rise in inflation will result in a decrease in the real yield of US Treasury bonds.
      • Exchange Rate Risk: If the US dollar depreciates, it will lead to a decrease in the investment return of US Treasury bonds.

      Buying and selling US Treasury bonds is a relatively complex process involving multiple factors and considerations. Here are some key issues to consider when trading US Treasury bonds:

      Interest Rate: The yield of government bonds is a key factor affecting their prices and investment returns. Generally, interest rates and bond prices are inversely related. That is, when interest rates rise, bond prices fall; when interest rates fall, bond prices rise. Investors need to closely monitor the Federal Reserve’s adjustments to interest rates, as well as other interest rate influencing factors in the market.

      Inflation: Inflation can impact the real return of bonds. If the inflation rate is higher than the annualized yield of a bond, the real return of the bond may be negative. Investors should consider the impact of inflation and may seek bonds that provide inflation protection, such as Treasury Inflation-Protected Securities (TIPS).

      Credit Rating: Although U.S. Treasury bonds are generally considered low-risk, investors should still pay attention to the credit rating of the U.S. government, as it may affect the price and attractiveness of bonds.

      Maturity Date of Bonds: Bonds with different maturity dates may have different interest rates and prices. Typically, long-term bonds have higher interest rates than short-term bonds, but they may also come with higher interest rate risk.

      Tax Implications: Interest income from U.S. Treasury bonds is tax-exempt at the federal level, but may be taxable at the state and local levels. Investors need to understand tax regulations and consider investment returns with tax implications in mind.

      Liquidity: U.S. Treasury bonds generally have high liquidity, but under certain market conditions, or for certain types or maturity dates of bonds, liquidity may vary.

      Purchase Channels: Investors can purchase U.S. Treasury bonds through various channels, including buying directly from the U.S. Department of the Treasury, or through banks, brokers, and online platforms. Understanding the advantages, disadvantages, and fee structures of different channels is crucial.

      The most important aspects to focus on are the discount, premium, and yield of bonds, as they are closely related to each other. Below is a brief explanation of these three concepts:

      Discount: When the market price of a bond is lower than its face value, the bond is considered to be sold at a discount. For example, if a bond with a face value of $1000 is priced at $950 in the market, then this bond is sold at a discount.

      Premium: Conversely, when the market price of a bond is higher than its face value, the bond is considered to be sold at a premium. For example, if a bond with a face value of $1000 is priced at $1050 in the market, then this bond is sold at a premium.

      Yield: The yield of a bond refers to the annualized rate of return on the bond investment. It is the ratio between the annual interest of the bond and its current market price. The yield is influenced by various factors, including market interest rates, bond credit ratings, and remaining maturity.

      Relationship between discount, premium, and yield:

      Discount and Yield: Generally, bonds purchased at a discount will have a higher yield. This is because investors pay a price below the face value, but can still receive the face value at maturity, resulting in a relatively higher yield.

      Premium and Yield: Conversely, bonds purchased at a premium typically have a lower yield. This is because investors pay a price above the face value, but can only receive the face value at maturity, leading to a relatively lower yield.

      Changes in Market Interest Rates: Fluctuations in market interest rates affect bond prices and yields. When market rates rise, the prices of existing bonds usually decrease, leading to higher yields; conversely, when market rates fall, bond prices typically rise, resulting in lower yields.

      In the bond investment process, understanding the relationship between discounts, premiums, and yields, and how they are influenced by market conditions, is crucial for making wise investment decisions.

      Investment Strategies:

      Investors should clearly define their investment objectives, risk tolerance, and investment horizon in order to choose the most suitable types of bonds and investment strategies. Therefore, when investing in U.S. Treasury bonds, investors should pay attention to risk control and allocate their investments based on their own investment goals and risk tolerance.

      Specifically, investors can consider the following points:

      1. Implement a phased investment strategy to reduce investment risks.
      2. Choose longer-term U.S. Treasury bonds to achieve higher yields.
      3. Monitor the monetary policy trends of the Federal Reserve and adjust investment strategies in a timely manner.

      If investors can effectively control risks, then “investing in U.S. Treasury bonds for retirement” is a good choice.

      Here are some specific investment suggestions:

      • Investors can invest in U.S. Treasury bonds through repurchase agreements with government securities. A repurchase agreement involves investors lending funds to banks, and the bank repaying the funds at a specified future date at an agreed interest rate. The yield of repurchase agreements with government securities is similar to U.S. Treasury bond yields, but with lower risks.
      • Investors can also invest in U.S. Treasury bonds through purchasing U.S. Treasury bond ETFs. U.S. Treasury bond ETFs are index funds that track an index of the U.S. Treasury bond market. U.S. Treasury bond ETFs have lower trading costs and are suitable for small investors.

      Investors should choose appropriate investment methods based on their investment objectives and risk tolerance.

      Conducting risk assessment: Before buying or selling US Treasury bonds, investors need to conduct risk assessment to determine their risk tolerance.

      Diversified investment: Investors can diversify their funds by investing in US bonds with different maturities and yields to spread risks.

      Long-term holding: US Treasury bonds have high security, allowing investors to hold them for the long term and gain stable returns.

      In fact, it is difficult to find long-term bonds with such high interest rates through general brokerage channels. Taking a certain brokerage as an example, it is rare to find a 4% Treasury bond portfolio on the APP. Here is a reference for you.

      In addition, the U.S. Treasury bond ETFs have experienced a significant collapse in bond prices and are gradually entering the buying zone, long-term investors may consider gradually getting involved.

      Chart of TLT trend:

      The chart shows the trend of TLT (iShares 20+ Year Treasury Bond ETF).

      As shown in the chart, the price of TLT has hit a new low since its listing.

      In the current situation, investment, like Chinese enterprises, also needs to be globalized. Therefore, a more diversified asset allocation is crucial. The U.S. stock market remains the top choice. During the pullback, it is recommended to pay close attention to Nasdaq ETFs: 159632, 159941, 513100, 513300, and 513110 are all worth focusing on!!!

    5. clearance sale! Buffett sells nearly 50% of Apple shares, cashing out hundreds of billions of yuan! Is the US stock market going to collapse? US Stock ETF Investment

      Buffett sells Apple, Snowflake, keeps hoarding cash, can the US stock market still play

      Recently, Buffett has been selling a large number of stocks, holding a pile of cash and bonds, which has attracted a lot of attention. His actions remind people of what he did before the financial crisis in the 1970s and 2008, and also make many people worry about whether the economy is going to have problems again.

      Historically, Buffett did this in the early 1970s and before the 2008 financial crisis. That two times, he sold stocks because he felt the market valuation was too high, not because he knew a crisis was coming. Buffett’s investment follows a simple principle: don’t buy stocks that are too expensive.

      Massive sell-off triggers volatility in the US stock market

      In 1969, Buffett believed that market stocks were generally overvalued and unable to find suitable investment targets, so he decided to liquidate and close his investment company.

      Despite experiencing bull markets in 1970 and 1972, he firmly believed in his investment philosophy and did not re-enter the market until 1973 when the market plummeted.

      Both of these operations are enough to prove that Buffett attaches great importance to valuation rather than predicting short-term market fluctuations.

      In 2008, before the financial crisis, Buffett began significantly reducing his stock holdings and hoarding cash, citing the inability to find investment opportunities with reasonable valuations at the time.

      Although Buffett’s performance lagged significantly behind the market in those years, he successfully bought the bottom after the 2008 financial crisis. It also proves that Buffett’s decision to hold a large amount of cash a few years in advance was wise.

      Now, Buffett has adopted a similar strategy, selling a large number of US stocks such as Apple and Snowflake, and hoarding a large amount of cash.

      This suggests that Buffett may believe that the current market valuation is too high and lacks attractive investment opportunities, rather than solely based on concerns about short-term economic crises.

      Buffett’s actions reflect his consistent investment logic: he would rather hold cash in an overvalued market than take the risk of buying overvalued stocks.

      From previous operations, Buffett did not rely on complex market forecasts, but firmly believed in simple and effective investment principles.

      This method may seem simple, but it is difficult to implement and requires great patience and discipline. This is also the reason why many ordinary investors cannot fully replicate Buffett’s operations.

      From Buffett’s behavior, it may indicate that the current market valuation is already at a high level and risks are accumulating.

      However, when it comes to whether to follow Buffett’s selling strategy, everyone needs to make a decision based on their own investment goals and patience. As Buffett said, the key to successful investment is to avoid overvalued stocks and maintain sufficient funds and patience when opportunities arise.

      Can the US stock market continue to play?

      We need to analyze this issue from multiple perspectives!

      What does Buffett’s behavior mean?

      Firstly, Buffett’s sell-off of Apple and Snowflake is not the first time, as he has previously reduced his holdings. This does not necessarily mean that he is not optimistic about the long-term development of these companies, but rather that he is adjusting his investment portfolio, controlling risks, or seeking other investment opportunities.

      Buffett’s approach is long-term investment, not just looking at the short-term market. So what he did was more defensive, not because he felt the market was about to collapse.

      Can the US stock market still play?

      Investors cannot just look at what Buffett does. Although he has sold some technology stocks, there are still many promising companies in the market that should be considered in the following three aspects.

      Investors can choose industries and stocks with long-term growth potential (such as technology, green energy, artificial intelligence), rather than just following the overall market trend.

      It is crucial to maintain attention and flexibly adjust the investment portfolio. Faced with market fluctuations, this is a good opportunity for prepared investors to seek opportunities for underestimation.

      Diversify investments and allocate assets reasonably to reduce risks in a single market or industry. A moderate cash holding ratio can effectively cope with market fluctuations and enter the market at the appropriate time.

      Is Buffett’s actions a warning?

      Buffett’s actions undoubtedly triggered market panic. However, the short-term trend of the market is not entirely driven by valuation, but is also influenced by factors such as liquidity, policies, and corporate profit expectations.

      Buffett is more of a defensive strategy, reminding investors to be vigilant at all times when the market is high. Buffett also emphasized the importance of cash.

      Ordinary investors need to be careful not to blindly follow the trend and make appropriate adjustments based on their own risk tolerance and investment goals. There are still many opportunities on the market that need to be carefully selected to avoid chasing high prices and unreasonable exposure risks.

      Interest rate cuts are coming, the economy is doing well, and there are many opportunities for the US stock market

      Weakening inflation data: economic cooling rather than recession

      The inflation data for July was lower than expected, with CPI and PPI rising by 2.9% and 2.2% respectively over the year. The prices of food, clothing, old and new cars, air tickets, etc. have all started to decline, indicating that consumer prices are slowly falling.

      However, the house and rent are still quite expensive, and the car insurance costs are not low. Although these places have lowered prices slowly, over time, the prices will gradually come down, helping to reduce overall inflation.

      Lowering inflation is beneficial for everyone. Consumers can save some money, which increases their willingness to buy things. This is a good thing for the economy,

      Once the Federal Reserve’s inflation rate drops and reaches their 2.0% PCE inflation target, it becomes feasible. In the coming months, if inflation continues to decline, the Federal Reserve may use this as an excuse to adjust policy, and may even start cutting interest rates.

      Simply put, inflation is good news for both the market and the Federal Reserve, which may affect how they adjust interest rates.

      Economic data exceeds expectations: Consumer spending and job market remain stable

      Previously, the market was worried about an economic recession due to the poor July non farm payroll report, but recently some economic data has been better than expected, easing these concerns.

      For example, retail sales in July increased by 1%, much higher than the expected 0.4%. The consumer expectation index was also good, and the number of people applying for unemployment benefits was decreasing, indicating that although the labor market has slowed down, it has not deteriorated sharply.

      The improvement of economic data tells us that although the US economy is cooling, it is still growing healthily. The rise of retail sales shows that consumers are very awesome, which is important because consumption accounts for a large proportion of US GDP.

      The unemployment rate has not increased, indicating that although the growth rate of the labor market has slowed down, there has been no large-scale unemployment.

      These data all support the market’s expectation of a “soft landing” for the economy, in simple terms, economic growth has slowed down a bit, but it will not lead to a recession.

      Federal Reserve policy path: Is the interest rate cut cycle about to begin?

      With the weakening of inflation data and the improvement of economic data, people increasingly feel that the expectation of the Federal Reserve launching a rate cut cycle at the FOMC meeting on September 18th is gradually increasing.

      Although some people speculate that the Federal Reserve will suddenly lower by 50 basis points, it seems unnecessary now. The Federal Reserve may be more inclined to gradually lower.

      The Fed’s interest rate cuts have a significant impact on the market, especially when everyone thinks the economic outlook is still good. Cutting interest rates can help businesses save money, make everyone happy, and may even boost the stock market.

      However, interest rate cuts may also prompt some investors to reconsider their assets, especially those high-risk, high return investments.

      So, the future direction of the Federal Reserve’s monetary policy is the focus of market attention.

      Market outlook: A diversified leading pattern may form

      Inflation has decreased, economic data has improved, and the market has rebounded, especially in technology stocks. The Federal Reserve may cut interest rates, which will broaden market hotspots and bring diversified investment opportunities.

      History tells us that interest rate cuts and an economic soft landing are good things for the market. Investors can turn to more industries, such as industry and finance, which can both diversify risks and seize opportunities.

      Against the backdrop of upcoming interest rate cuts and relatively stable economic conditions, the following types of ETFs may be worth paying attention to:

      Large value ETFs: With the start of the interest rate cut cycle, a stable economic situation and a low interest rate environment will help improve the performance of value stocks, especially those companies with stable profitability and stable cash flow. Value based ETFs such as Vanguard Value ETF (VTV) or iShares Russell 1000 Value ETF (IWD) may benefit from this trend.

      High dividend ETF: In a low interest rate environment, investors often prefer assets that provide stable dividend returns because these assets can provide more reliable returns when interest rates fall. High dividend ETFs such as Vanguard High Dividend Yield ETF (VYM) or iShares Select Dividend ETF (DVY) are worth considering.

      Real Estate Investment Trusts (REITs) ETFs: Interest rate cuts typically benefit the real estate market, especially REITs, as lower interest rates can lower financing costs and increase property values. REITs ETFs such as Vanguard Real Estate ETF (VNQ) or Schwab US REIT ETF (SCHH) may perform well in a rate cutting environment.

      Technology and Growth ETFs: Although value stocks may perform well in this environment, as economic growth is sustained, technology and growth stocks may continue to benefit, especially when interest rate cuts bring lower financing costs. Technology based ETFs such as Invesco QQQ Trust (QQQ) or Vanguard Information Technology ETF (VGT) can continue to benefit from long-term growth trends.

      Cyclical industry ETFs: Stable economic growth typically drives the performance of cyclical industries such as industry, finance, and materials. The performance of these industries is closely related to the economic cycle and usually performs well during periods of economic expansion. Cyclical industry ETFs such as Industrial Select Sector SPDR Fund (XLI) or Financial Select Sector SPDR Fund (XLF) may be worth paying attention to.

      Against the backdrop of upcoming interest rate cuts and stable economy, investors can consider investing in ETFs in value, high dividend, REITs, technology and growth, and cyclical industries. These types of assets not only provide potential returns when interest rates fall, but also benefit from an environment of stable economic growth.

      Disclaimer: The content of this article is for reference only and does not constitute investment advice. Investment carries risks, and caution is necessary when entering the market.

    6. Global risk assets are in a frenzy, have they been overbought? What should we buy?

      「Global risk assets are in a frenzy, have they been overbought? What should we buy?」

      Overnight, there was a big turnaround! In the past, there was a lot of panic, but after the November FOMC meeting of the Federal Reserve, the market became very cheerful. This market, like a June day, was gloomy and rainy not long ago, but overnight, the sun shone brightly.

      The core of all this lies in the anchor of global risk asset pricing: the yield on the 10-year US Treasury bond has finally confirmed a peak. As can be seen from the chart below, after the announcement early Thursday morning to continue the pause in rate hikes, the US Treasury yield quickly fell from its high levels. Following the release of the US non-farm payroll data for October on Friday, it reinforced the expectation that the Federal Reserve would not continue to raise interest rates. As a result, the US Treasury yield plummeted again, dropping from 5% to 4.5% in just one week.

       「Chart of the 10-year U.S. Treasury Yield Trend」

      The Federal Reserve is finally about to end its fastest rate hike in 40 years. The end of the rate hike means that the 10-year U.S. Treasury yield has peaked, and global risk assets can finally catch their breath. Since 2022, along with the European and American central banks, there has been the fastest round of rate hikes in decades. Yields on European and American government bonds have been rising rapidly, suppressing the performance of global risk assets and intensifying volatility.

      In recent times, inflation in Europe has continued to fall, and inflation in the United States is also on a downward trajectory. Moreover, the non-farm payroll data in the United States is significantly below expectations, and the loosening of the job market has ultimately led the Federal Reserve to finally lose the courage and determination to maintain a consistently hawkish stance.

      According to the latest expectations of a rate hike by the CME, the anticipated rate cut by the Federal Reserve in 2024 has been pulled back by 100 basis points, and the pressure on risk assets from the rate hike is gradually easing.

      「The shift in liquidity expectations has become the new focus of the market!」

      Both $ARKK and $LABU  have seen significant performance improvements in the past few trading days, indicating that the market is entering a new phase. In this phase, the favorable impact brought by the decrease in discount rates on the denominator side enhances the gaming opportunities for high beta elastic assets.

      Although Yancai is more inclined to invest in leading companies in the investment industry, the rebound of high beta assets is now unfolding, and this phase of the rebound is mainly driven by the decline in Rf (risk-free rate level).

      2009-2016: Both earnings and valuations rose, the new economy grew rapidly, the US dollar QE dominated a vigorous bull market for a decade.

      2016-2018: Earnings increased, with rate hikes and balance sheet reduction cycles, valuation fluctuations were not significant, and the bull market in US tech stocks continued.

      Q4 2018: Late stage of balance sheet reduction, economic recession, declining earnings, significant stock market adjustment.

      2020-2021: Epic monetary easing, PE expansion dominated, a vigorous bull market in tech stocks.

      November 2021-February 2023: Fed tightening, strengthening Rf, PE decline leading trading, resulting in stock market killing valuations.

      March 2023-May 2023: Liquidity crisis, Fed tightening expectations peak, weakening Rf, PE recovery, EPS fluctuations are not significant.

    7. The Fed’s interest rate cut signal is clear, which ETFs will benefit first? US Stock ETF Investment

      Waving goodbye to interest rate hikes, the September rate cut has finally arrived

      Powell’s speech in Jackson Hole pointed out the next steps for monetary policy. The interest rate cut has finally officially begun, a new stage, a new journey!

      Key information revealed in Jackson Hole’s speech

      Enhance confidence in the decline of inflation

      Powell said that he is increasingly confident that inflation can steadily return to the 2% target. This statement is quite crucial, indicating that the Federal Reserve believes that its previous monetary policy to address high inflation has been effective. The reduced inflationary pressure and stable job market have given the Federal Reserve more policy choices.

      The strengthening of this confidence may pave the way for future interest rate cuts. As inflation stabilizes, the Federal Reserve will have more room to adjust interest rates to support economic growth. The market may respond positively to this signal, especially in the bond and growth stock sectors.

      Interpretation of the Labor Market

      Powell said that the labor market is no longer as hot as before, much looser than before the pandemic. But at the same time, he also said that the Federal Reserve does not want to see the market get colder, which means that while they want to stabilize prices, they must also ensure that the job market is awesome.

      This means that the Federal Reserve will handle interest rate policy adjustments cautiously and does not want to harm the job market through excessive tightening of monetary policy. This move may reduce market concerns about economic recession and support the performance of the stock market, especially consumer and cyclical stocks.

      Opportunity for policy adjustment

      Powell made it clear that ‘the time for policy adjustment has come,’ implying that the Federal Reserve may need to loosen monetary policy. Although he mentioned that the interest rate cut depends on the upcoming data and economic situation, both inside and outside of his words revealed that the Federal Reserve feels that the current policy is too tight and is prepared to relax it at the appropriate time.

      It may intensify market expectations for interest rate cuts, especially next year. Investors may reassess their investment strategies in a high interest rate environment, focusing more on asset classes that benefit from a low interest rate environment, such as growth technology stocks and high-yield bonds.

      Reduced supply chain and pandemic pressure

      Powell emphasized that the pressure on the supply chain and market caused by the epidemic is gradually subsiding. These problems were the main reasons for the previous rise in inflation. Now that these problems are gradually being resolved, the downward pressure on inflation will become more significant.

      The recovery of the supply chain and the rebalancing of market supply and demand mean that inflationary pressures will further ease in the future. This will make the Federal Reserve more composed in adjusting monetary policy and create a more favorable environment for global economic recovery.

      Optimistic attitude towards future uncertainty

      Even though Powell is more optimistic about inflation and the job market, he still emphasizes that policy makers need to maintain a low profile and be flexible. He mentioned that economists’ models cannot predict everything, and the Federal Reserve needs to continue monitoring the market and data, with policies that can be adjusted at any time.

      Reflecting the uncertainty of the Federal Reserve’s future economic environment, it may indicate that policy adjustments will be gradual and data-driven. The market may remain cautiously optimistic as a result, waiting for further guidance from future data.

      Which ETFs benefit the most from the interest rate cut cycle?

      stock market

      Stock market rebound and cyclical performance: Historically, when the Federal Reserve cuts interest rates, the stock market usually rebounds, especially in years like 1987, 1995, and 1998, which were not accompanied by severe economic downturns. Interest rate cuts often increase liquidity in the market while reducing corporate financing costs, often leading to a rise in the stock market. However, the stock market rebound will also be accompanied by fluctuations, because interest rate cuts are usually made when the economy is not awesome or there is downside risk.

      Industry rotation and sector performance: When interest rate cuts occur, interest rate sensitive industries (such as real estate, finance, and consumer stocks) usually perform better. Because these industries have reduced financing costs in a low interest rate environment. But as interest rate cuts continue, technology stocks may begin to be favored, especially when people believe that the economy will improve in the future.

      bond market

      Yield curve and bond price: interest rate cuts usually lower short-term and long-term bond yields, leading to steeper yield curves, which is good news for long-term treasury bond, because bond prices will rise when yields fall. In addition, as inflation expectations decrease, the attractiveness of inflation protected bonds (TIPS) may decrease.

      Credit bonds and high-yield bonds: Interest rate cuts usually improve the financing environment for companies, making it easier and cheaper for them to borrow money. This reduces the cost gap (credit spread) of borrowing, which is good for the high-yield bond market. But if the economy declines severely, the risk of high-yield bonds will increase because the default rate of enterprises may rise.

      foreign exchange market

      The exchange rate of the US dollar and global currencies: If the Federal Reserve cuts interest rates, the US dollar will depreciate, especially for countries that are still tightening their monetary policies. At this point, emerging markets and countries that rely on exporting commodities may perform better.

      Capital flows and foreign exchange reserves: Interest rate cuts have caused the US dollar to fall, and international investors may seek higher yielding assets, leading to capital flows to emerging markets. However, this may also exacerbate the instability of global capital flows, especially for economies that are highly dependent on US dollar financing.

      commodity markets

      Gold and precious metals: Interest rate cuts usually benefit gold as they lower the cost of holding it. At the same time, the interest rate cut accompanied by the depreciation of the US dollar further pushed up the price of gold. Other precious metals such as silver may also benefit from the expected increase in industrial demand.

      Crude oil and industrial metals: The interest rate cut gives the impression that the global economy will grow, and the demand for commodities such as crude oil and industrial metals may increase. However, if the economic slowdown is more severe than expected, these commodity prices may not rise.

      Real estate market

      Mortgage interest rates and real estate prices: Cutting interest rates directly lowers mortgage interest rates, making the real estate market more attractive. Low interest rates often stimulate people’s desire to buy houses, which may lead to a rise in housing prices, especially in markets with limited supply.

      Commercial real estate and REITs: Commercial real estate and real estate investment trusts (REITs) have performed well during interest rate cuts, as financing costs have decreased and it would be even better if the rental market remained stable. But if the economy is not good, commercial real estate may face the risk of reduced rental demand.

      Alternative assets and hedging strategies

      Private equity and hedging strategies: The interest rate cut cycle is usually beneficial for private equity, as financing costs are reduced and leveraged buyouts or portfolio adjustments are more attractive. Hedge funds can make money from market fluctuations by utilizing flexible strategies, such as macro hedging, to seize opportunities brought about by currency and interest rate changes.

      Cryptocurrency: The cryptocurrency market is relatively new, but in the past, as liquidity increased and the US dollar fell, digital currencies such as Bitcoin rose well. However, investors should be cautious about the high volatility and regulatory risks of such assets.

      International and Emerging Markets

      Developed markets and emerging markets: The Federal Reserve’s interest rate cuts are generally a good signal for emerging markets, as capital flows and the decline of the US dollar can support economic growth and asset price increases in these markets. However, if the global economy deteriorates, a reversal in capital flows may have adverse effects. If the policies in developed markets are different, emerging markets may also be more volatile.

      Market expectations and sentiment

      Expectation management and market volatility: The initiation of interest rate cuts often accompanies adjustments in market expectations. Investors’ expectations of the Federal Reserve’s path may lead to fluctuations in market sentiment, especially in situations where the path of interest rate cuts is uncertain and economic data is volatile. Investors should closely monitor changes in policy signals and economic data to cope with market risks.

      During the interest rate cut cycle, increasing the allocation of long-term assets is usually a reasonable strategy:

      The pricing of long-term assets is sensitive to interest rates. When interest rates decrease, the discount rate of future cash flows decreases, leading to an increase in the underlying asset. Therefore, long-term assets (long-term bonds, growth stocks, and overvalued technology stocks) often perform better during interest rate cut cycles.

      In the bond market, bonds with longer maturities are more sensitive to interest rates. During interest rate cuts, holding long-term bonds can result in better capital appreciation, as the decrease in interest rates leads to an increase in bond prices. This is also the reason why investors usually increase the allocation of long-term treasury bond and highly rated corporate bonds in the interest rate reduction cycle.

      The valuation of growth stocks usually depends on the expected growth of future cash flows. As the cash flows of these stocks are typically distributed over a longer period of time, their discounted value will significantly increase as interest rates decrease. Therefore, growth stocks often perform better than value stocks in interest rate cuts.

      Real estate and infrastructure assets are often considered long-term assets because their income streams are relatively stable and long-lasting. Interest rate cuts have lowered financing costs, making these assets more attractive. Low interest rates often result in higher returns on real estate and infrastructure investments.

      Although increasing the layout of long-term assets usually has good return potential during interest rate cutting cycles, it is also necessary to pay attention to potential risks. If the economic situation deteriorates or inflation exceeds expectations, it may lead to a reversal of market sentiment, thereby affecting the performance of long-term assets. Therefore, investors should make a balanced allocation based on their own risk tolerance and market expectations.

      For ETF investors, the following ETF types and reasons may benefit:

      Bond ETF

      Long term treasury bond bond ETF: Powell mentioned that inflation pressure is easing, which indicates that long-term interest rates may decline. Therefore, the price of long-term treasury bond bonds may rise, and related ETFs such as iShares 20+Year Treasury Bond ETF (TLT) will benefit from it. Investors can consider increasing the allocation of such bond ETFs to enjoy the capital appreciation brought by the decrease in interest rates.

      Growth stock ETF

      NASDAQ 100 ETF: With the Federal Reserve hinting that the time for policy adjustment has come, market expectations for interest rate cuts have increased, which is particularly beneficial for growth stocks that rely on a low interest rate environment. NASDAQ 100 ETFs such as Invesco QQQ Trust (QQQ) may receive a premium due to their inclusion of a large number of technology stocks and other growth companies.

      High Yield Bond ETF

      If the expectation of interest rate decline increases, the risk premium of high-yield bonds may shrink, leading to an increase in the prices of these bonds. High yield bond ETFs such as iShares iBoxx $High Yield Corporate Bond ETF (HYG) may benefit from it and are suitable for investors seeking higher returns.

      Gold ETF

      The policy adjustments mentioned by Powell may depress the US dollar, especially in the context of interest rate cuts, which typically drive up gold prices. SPDR Gold Shares (GLD) and other gold ETFs are ideal choices for hedging against currency depreciation risks and inflation expectations.

      Real estate ETF

      Real Estate Investment Trusts (REITs) ETF: With policy adjustments and lower interest rates, the cost of real estate financing will be reduced, thereby increasing the attractiveness of the real estate market. The Vanguard Real Estate ETF (VNQ) may perform well and is suitable for investors seeking stable cash flow.

      Under the expectation of interest rate cuts, long-term assets usually perform well, especially those industries with high growth potential, such as cloud computing and biotechnology. The following are recommendations for long-term ETFs in the cloud computing and biotechnology fields:

      ETF recommendations in the field of cloud computing

      Global X Cloud Computing ETF (CLOU): Focusing on cloud computing related companies, covering companies from Infrastructure as a Service (IaaS), Platform as a Service (PaaS) to Software as a Service (SaaS) and other fields. Invest in cloud computing companies with strong growth potential, which typically perform better in low interest rate environments because their future cash flows have a higher discounted value.

      WisdomTree Cloud Computing Fund (WCLD): invests in cloud computing companies with high growth potential, especially those whose business models rely on subscription revenue. The investment portfolio of this ETF focuses on small and medium-sized growth companies, which often perform well in low interest rate environments.

      ETF recommendations in the field of biotechnology

      IShares Nasdaq Biotechnology ETF (IBB): covers large and medium-sized biotechnology companies listed on NASDAQ, focusing on the biotechnology and pharmaceutical sectors. The biotechnology industry typically has a long research and development cycle and enormous growth potential, therefore, in a low interest rate environment, the long-term characteristics of IBB ETFs make them have good investment prospects.

      ARK Genomic Revolution ETF (ARKG): an innovative company focused on genomics, biotechnology, and related fields. This ETF is managed by the renowned ARK Investment Management and invests in companies with disruptive potential. ARKG’s investment portfolio includes some cutting-edge biotechnology companies that are expected to achieve significant technological breakthroughs and market growth in the future, making them suitable for long-term investors.

      For investors who hope to benefit from the interest rate cut cycle, long-term ETFs in the fields of cloud computing and biotechnology are ideal choices. ETFs such as Global X Cloud Computing ETF (CLOU) and iShares Nasdaq Biotechnology ETF (IBB) provide extensive industry coverage.

      Meanwhile, WisdomTree Cloud Computing Fund (WCLD) and ARK Genomic Revolution ETF (ARKG) focus on high growth and innovative companies. These ETFs not only perform well in low interest rate environments, but also have long-term growth potential, making them suitable for long-term investors to invest in.

      For ETF investors, the above-mentioned bonds, growth stocks, high-yield bonds, gold, and real estate ETFs may be the best allocation choices. These ETFs can not only benefit from potential interest rate cuts, but also provide diversified asset classes to cope with future market volatility.

      Disclaimer: The content of this article is for reference only and does not constitute investment advice. Investment carries risks, and caution is necessary when entering the market.

    8. Analysts: Fed Rate Cut in December “Almost Certain,” but a “Pause” Expected in January

      On Wednesday (November 13), the U.S. Bureau of Labor Statistics reported that inflation rose in October, but the increase was broadly in line with Wall Street’s expectations.

      The Consumer Price Index (CPI), which measures the cost of a broad range of goods and services, increased by 0.2% in October.

      This brought the annual inflation rate to 2.6%, up 0.2 percentage points from September. Core CPI, which excludes food and energy prices, saw a more notable rise. The core CPI rose by 0.3% in October, bringing the year-on-year increase to 3.3%, which also matched expectations.

      Following the data release, traders significantly raised the odds of the Federal Reserve cutting its benchmark interest rate by 0.25 percentage points in December.

      Energy costs, which had been falling in recent months, remained flat in October, while food prices rose by 0.2%. Compared to the same month last year, energy prices fell by 4.9%, while food prices increased by 2.1%.

      While inflation eased in other areas, housing costs remained the main driver of CPI growth.

      The housing index, which accounts for about one-third of the CPI’s overall weight, rose by 0.4% in October, double the increase in September, and was up 4.9% year-on-year. According to the Bureau of Labor Statistics, housing prices contributed to more than half of the total CPI increase.

      Used car prices also rose, up 2.7% from the previous month, while motor vehicle insurance dropped by 0.1%, though it still rose by 14% year-on-year.

      Airline fares increased by 3.2%, while egg prices dropped by 6.4%, but were still 30.4% higher than the previous year.

      In another report, the Bureau of Labor Statistics stated that inflation-adjusted average hourly wages for workers rose by 0.1% in October, up 1.4% compared to the same time last year.

      This data further diverges from the Fed’s 2% inflation target and could complicate the Federal Reserve’s future monetary policy, especially with a new government set to take office in January.

      Morgan Stanley Wealth Management’s Chief Economic Strategist, Ellen Zentner, commented: “The CPI data wasn’t a surprise, so the Fed should still be on track to cut rates again in December. However, given the uncertainty around President Trump’s policies, the situation next year will be different. The market is already weighing the possibility that the Fed may reduce rates less frequently than previously expected in 2025, and they could pause as early as January.”

      The economic plans of the elected President, Donald Trump, could further exacerbate inflation. Despite a cooling of inflation from its peak in mid-2022, inflation continues to pose a serious challenge for U.S. households.

      As a result, traders have recently reduced their expectations for Fed rate cuts. The Fed has already lowered its benchmark lending rate by 0.75 percentage points and is expected to implement more aggressive cuts.

      However, traders now anticipate that by the end of 2025, the Fed will have only cut rates by 0.75 percentage points, about half a percentage point less than pre-election expectations.