Blog

  • 5 Years of 37% Decline! Consistently Underperforming the Market, Is Disney’s Fairy Tale Dream Shattering?

    Disney — A Mediocre Company with “Magic”

    Warren Buffett once said, “It’s far better to buy a wonderful company at a fair price than a fair company at a wonderful price.” Despite the fame of some companies, they are actually mediocre or even poor businesses.

    In our previous article “Boeing Plead Guilty and Accept Penalty! From a Giant to a ‘Junk Stock‘, How Can US Retail Investors Avoid the Minefield of Earnings Culture,” we detailed the process by which Boeing’s (BA) stock became a junk stock due to its earnings culture.

    Today, we turn our attention to Disney (DIS), which, in my view, is a “dazzling” representative of mediocrity due to management issues. Although DIS is not as frequently the focus of stock reviews as the big tech sisters, it remains one of the hot topics in the market.

    The Disney Company, this global entertainment giant shining with the glow of magic, began in 1923 and was co-founded by the dreamers, the Disney brothers.

    For nearly a century, this company has grown into a diversified international family entertainment and media empire, capturing the hearts of audiences worldwide with its unparalleled creativity and spirit of innovation.

    Disney possesses a strong moat:

    • Exceptional brand influence: Disney has built a complete industry chain around IPs, including movies, television, theme parks, consumer products, etc., achieving all-around monetization of IPs. This industry chain integration capability is difficult for other competitors to imitate.
    • A wealth of high-quality IP resources: Disney has accumulated a wealth of high-quality IP resources through independent innovation, historical resource mining, and mergers and acquisitions. These IPs include classic animated characters, Marvel superheroes, Star Wars, etc., providing the company with a continuous source of creativity and a stable source of income.
    • A complete IP industry chain: The Disney brand has extremely high visibility and reputation worldwide, representing positive values such as joy and dreams, which has won the company a loyal customer base.

    However, under these dazzling lights, it is hard to conceal Disney’s increasingly mediocre performance. First, the stock price has fallen by about 37% over the past five years, significantly underperforming the broader market.

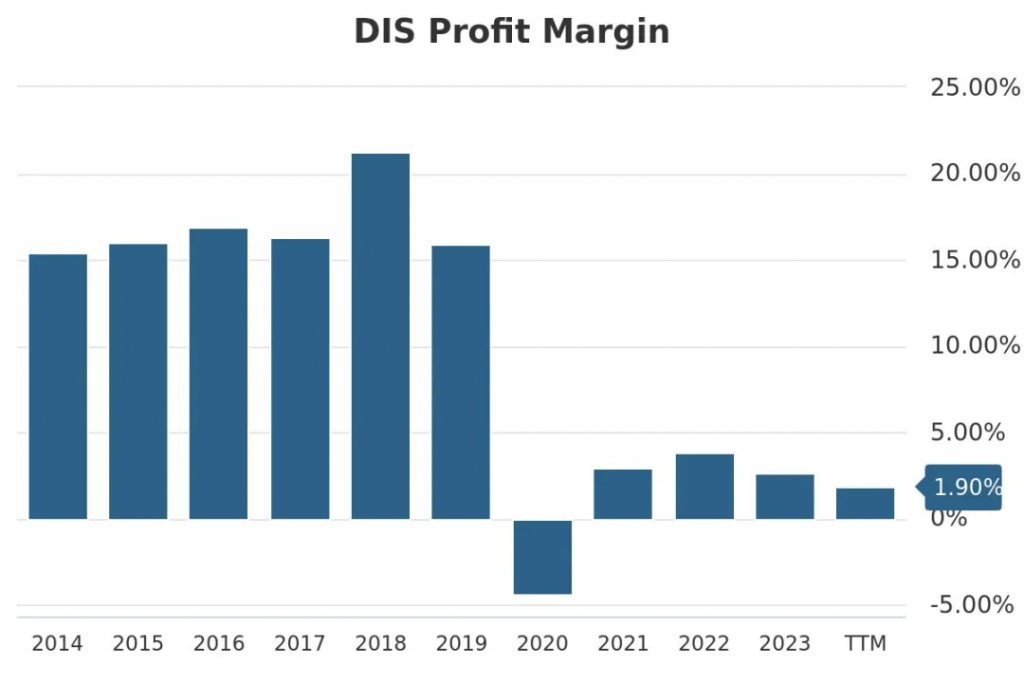
    The low stock price trend is just a manifestation; the underlying cause is the weakening of its profitability. Looking at Disney’s net profit margin over the past decade, we find that since 2020, this company with strong competitive advantages has had a profit margin of less than 5%, with no trend of improvement.

    Further analysis shows that Disney’s business is mainly divided into three segments:

    • Entertainment business: In fiscal year 2023, revenue was $40.635 billion, with a profit of $1.444 billion, and a net profit margin of 3.55%.
    • Sports business: In fiscal year 2023, revenue was $17.111 billion, with a profit of $2.465 billion, and a net profit margin of 14.41%.
    • Experience business: In fiscal year 2023, revenue was $32.549 billion, with a profit of $8.954 billion, and a net profit margin of 27.51%.

    It is clear that the experience business (including theme parks and cruises) is Disney’s most profitable segment, which aligns with the intuitive perception of ordinary consumers.

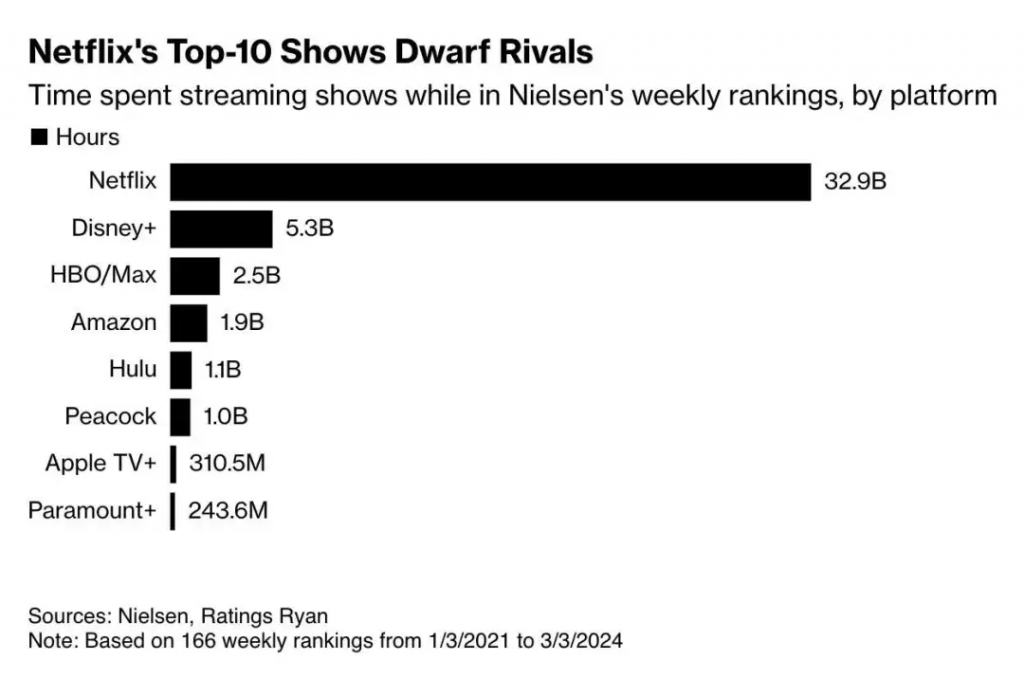
    However, it is puzzling that Disney, with a wealth of high-quality IP resources, has suffered a significant setback in its entertainment business (including Disney+, Hulu, and ESPN+), with a profit margin far lower than its competitor Netflix’s 19.54%, which is quite disappointing.

    Disney officially entered the streaming business in 2019, and during 2020 to 2021, the number of Disney+ subscribers grew rapidly. Relying on Disney’s unparalleled brand influence and IP advantages, the market was full of expectations for its transformation into a streaming technology company.

    As a result, many people began to worry that Netflix’s profitability would be challenged by Disney.

    This phenomenon inevitably leads people to attribute the cause to management issues. A specific analysis of Disney’s profit margins shows that the overall gross margin is actually acceptable, maintaining above 30% over the past decade, such as 33.41% in 2023.

    However, the operating profit margin for the same year was only 10.50%, which means that operating expenses such as management, sales, and advertising accounted for 68.72% of the gross margin.

    In fact, Disney’s management has been criticized in recent years, affecting the company’s operational efficiency:

    • Frequent leadership changes: Disney has experienced several ups and downs in leadership succession. In 2020, Bob Chapek succeeded as CEO, but due to his shortcomings in company strategy and communication, he was forced to step down after two years, and Bob Iger returned to the company as CEO. This frequent leadership change has led to internal instability and affected the continuity and execution of decision-making.
    • Lack of succession planning: Disney has a noticeable deficiency in succession planning. After Iger returned as CEO in 2022, one of his top tasks was to find a suitable long-term successor. However, the lack of succession planning and uncertainty make the stability of the company’s future leadership a concern.
    • Strategic and execution issues: Disney has invested heavily in the streaming business but faces high content production costs and fierce market competition. Although Disney+ has achieved some success in user growth, profitability remains a significant challenge. Disney has adopted a strategy in content production to reduce quantity and improve quality, especially in Marvel series movies. However, this strategy has not been significantly effective, and some movies and programs have suffered box office failures due to poor content quality and market feedback. In addition, the company has faced market resistance to some works due to their progressive themes when promoting diversity, equity, and inclusion (DEI) content, affecting box office and revenue.
    • Shareholder pressure and governance issues: Disney’s shareholders have questioned the performance of the company’s management, especially activist investor Nelson Peltz, who has criticized the company’s governance and strategy and is seeking a board seat to promote change. This shareholder pressure further exacerbates the instability of the management.

    In summary, although Disney has a very strong moat, and analysts’ ratings for DIS stocks are mostly “buy” or “strong buy,” given the serious problems with the management, I do not recommend the stock. It is advised to wait and see until Disney solves its management issues and improves its net profit margin.

  • Is the lackluster performance of the US stock market today a precursor to a major pullback?

    The U.S. stock market is cooling down.

    Let’s start by discussing the market. Today, the market has seen a rare cooling off, with the recent hot Trump trade taking a brief pause, failing to rise against the trend. So, a question that must be asked is whether today’s trend is a precursor to a major retreat or just a buildup before a surge? With current high valuations in the US stock market, is it starting to show signs of strain?

    To answer these questions, we need to first take a look at the current market layout. Today, Bank of America released its global fund manager survey. This survey was conducted last week, and because last week was the US election week, Bank of America specifically distinguished between changes before and after the election. Let’s start by looking at this table. It can be seen that the majority of the rightmost column reflects upward green arrows, and if there are double arrows, it indicates a significant rise. Therefore, we will focus on the sections with double arrows.

    The top three lines are about the economy and inflation. It can be seen that in the survey conducted in October, institutions had negative views on both the economy and inflation, indicating that more people believed the economy would worsen and inflation would decline. However, such views significantly converged after entering November, and ultimately completely reversed after the election. Among them, the proportion of institutions believing that the U.S. economy would strengthen increased from a negative 22% to a positive 28%, while those believing that global inflation would rise changed from -44% to 10%. This shift is of great significance, indicating a change in institutional views, as they have abandoned the soft landing perspective and are now more inclined towards a no-landing judgment.

    This optimistic economic sentiment is also reflected in investment allocation. After the election, institutions’ risk appetite showed a noticeable increase. As seen in the last two lines, 35% of institutions believe that small-cap stocks will outperform large-cap stocks, and 41% of institutions believe that high-yield bonds will outperform investment-grade bonds. These are typical manifestations of increased risk appetite. This sentiment is also reflected in the stock market, with 29% of institutions being overweight on U.S. stocks, a proportion that has reached a new high in the past 11 years. 6% of institutions chose to be overweight on Japanese stocks, while technology and stocks from developing countries have also become more favored. These are generally considered riskier assets.

    Some viewers may ask, why are institutions so optimistic? Apart from a better economy and higher inflation, aren’t they afraid of the Fed raising interest rates? In surveys, institutions now also believe that rising inflation is the biggest risk, but it is not fully reflected in their positioning. How should we understand this? Aggie believes that this positioning indicates that institutions are more optimistic about the economy than the threat of inflation. As long as the economy remains strong, corporate profits will perform better, driving stock prices higher.

    There is another noteworthy change in this survey. It is the institutions’ views on various assets next year. As shown in the chart, after Trump’s election, fund managers’ optimism about US stocks has significantly increased, while other asset categories have not shown such a significant change. This aspect also reflects the strong confidence that global institutions currently have in US stocks.

    However, such consistent optimism, could it be a dangerous signal instead? It should be noted that the valuation of the U.S. stock market is already very high. According to Factset’s analysis, the forward price-to-earnings ratio of the S&P 500 has reached a new high in over three years, standing at 22.2 times. The last time it exceeded 22 times was back in April 2021, when the Federal Reserve was implementing unlimited quantitative easing, a far cry from the current close to 5% interest rate level. Many believe that such valuation levels are bound to reach a breaking point.

    Aggie believes that the optimism of institutions has clearly increased the possibility of a future pullback in the U.S. stock market, which definitely needs to be guarded against, otherwise it would be blindly chasing highs. However, even if a pullback occurs in the future, I do not think it will be very deep. Instead, it may present an opportunity for us investors to buy in. Why do I say this? In fact, there is something that seems very reasonable in the analysis above, but has been repeatedly refuted. That is, a good economy will lead to higher inflation. The U.S. economy has been telling us for the past two years that even with a very good economy, inflation can also fall, but the boost to corporate profits from a good economy is certain. So, faced with a certain change and an uncertain change, the choice for investment is very clear. Of course, it must be emphasized here that one of the biggest risks for U.S. stocks is the rise in inflation leading to the Fed raising interest rates again, but this risk needs data support. Before there are clear signs of significant growth in inflation data, we should not be overly concerned.

    Furthermore, there is another phenomenon that can also indicate that although the current market sentiment is relatively high, it has not reached the point of mindless frenzy. That is the performance of this earnings season. From the chart, it can be seen that the current market is clearly rewarding and punishing, giving better gains to stocks that outperform expectations, but on the other hand, the punishment is more severe. If the performance is below expectations, there will be more significant declines. This actually represents the underlying nature of the current market, which still demands fundamentals and is not solely driven by FOMO sentiment, which is worth noting.

    Reference article: WeChat Official Account “MeiTouinvesting”
  • Interest rate cuts are coming, causing the S&P and Nasdaq to stabilize, with the AI boosting the biotechnology sector in the US stock market. Looks like the biotech sector is about to heat up! [Investing in US stock ETFs]

    Translation: The fluctuation of funds, the interest rate reduction cycle, AI empowerment, and the U.S. biotechnology sector are worth paying attention to.”

    The stock prices of major tech companies have started to decline, and investors are shifting their focus towards small companies and the pharmaceutical industry. For example, that SPDR S&P Biotech ETF has recently surged significantly, even outperforming the Nasdaq.

    Why is that? Many companies in the biotech sector are particularly sensitive to interest rates.
    So, a rate cut by the Federal Reserve is a big positive for them.
    Firstly, it becomes easier to obtain financing, as the cost of borrowing decreases.
    There is an increase in merger and acquisition activities, as large companies are more willing to expand their territories in a low-interest rate environment.
    Investors are more willing to take risks, as low interest rates make them more inclined to seek high-return investments.
    There is an increase in research and development investment, as the cost of financing is low, allowing companies to allocate more money towards R&D.
    Market liquidity improves, as a rate cut attracts more funds into the stock market.
    In the long run, a rate cut can enhance market confidence, providing a stable investment environment for the biotech industry, which is conducive to long-term development.

    Analyzing two historical cases:

    After the 2008-2009 financial crisis, the Federal Reserve significantly lowered interest rates and implemented quantitative easing policies, benefiting the biotechnology industry significantly. The improvement in financing environment and increased market liquidity propelled companies’ research and innovation, leading to outstanding overall performance in the industry.

    During the 2020 COVID-19 pandemic, the Federal Reserve swiftly lowered interest rates to near zero and implemented large-scale quantitative easing policies. Biotechnology companies, especially those involved in vaccine research and therapeutic drug development, garnered attention and investments, resulting in a very robust industry performance.

    Looking back at past interest rate cycles, the performance of the biotechnology sector:

    From 2001 to 2003, following the burst of the dot-com bubble, the biotechnology sector faced some challenges, but certain companies still performed exceptionally well, such as Amgen and Gilead.

    During the global financial crisis of 2007-2008, the biotechnology sector demonstrated relative stability. Gilead Sciences stood out with its successful performance in antiviral drugs.

    In 2019-2020, during the COVID-19 pandemic, the biotechnology sector’s performance was particularly impressive. The development of vaccines and treatment solutions drove strong growth in the sector. Moderna and Pfizer stood out in particular.

    Key factors influencing sector performance include research and innovation, M&A activities, regulatory environment, and market sentiment.

    With the support of AI, biotechnology can accelerate drug development, advance precision medicine, discover biomarkers, and optimize clinical trials.

    Under the dual influence of AI and interest rate cycles, companies can enhance valuation, reduce financing costs, and increase market liquidity.

    Here are two examples:

    Moderna (MRNA): Moderna is a biotechnology company specializing in mRNA technology, which has achieved significant success in the development of the COVID-19 vaccine. The use of AI technology has accelerated the research and production of vaccines.

    During the interest rate cut cycle in 2020, Moderna’s stock price surged significantly, rising from around $20 at the beginning of the year to around $100 by the end of the year, representing an increase of approximately 400%.

    Illumina (ILMN): Illumina is a genetic sequencing company that leverages AI technology to enhance the speed and accuracy of genetic sequencing. AI technology has helped Illumina make breakthroughs in genomics research and precision medicine.

    During the interest rate cut cycle from 2019 to 2020, Illumina’s stock price performed strongly, rising from around $300 at the beginning of 2019 to around $400 by the end of 2020, an increase of approximately 33%.

    The dual benefits of AI and interest rate cuts have made the biotechnology industry a hot spot for investment.

    Which ETFs are worth focusing on?

    It is difficult to evaluate individual stocks, as the success of R&D pipelines is highly contingent. Therefore, the best way to invest in the biotechnology sector is to allocate funds to ETFs.

    Primary biotechnology-related ETF

    iShares Nasdaq Biotechnology ETF (IBB):Track the NASDAQ Biotechnology Index. Holdings include large biotechnology companies such as Moderna, Amgen, Gilead Sciences, Regeneron, and others. Suitable for broad market participants looking to invest in the entire biotechnology sector.

    SPDR S&P Biotech ETF (XBI):Track the S&P Biotechnology Select Industry Index. It maintains a balanced portfolio, covering large, mid, and small-cap biotechnology companies, including many blue-chip companies such as Amgen, Gilead Sciences which recently gained popularity due to its HIV prevention drug, and Fosun Pharma. The high industry diversification helps reduce individual stock risk.

    ARK Genomic Revolution ETF (ARKG):A company focused on the genomics field. Its portfolio includes innovative companies such as CRISPR Therapeutics and Illumina. Suitable for investors interested in investing in the cutting-edge biotechnology sector.

    VanEck Vectors Biotech ETF (BBH):Track the MVIS U.S.-listed Biotech Index. The holdings are concentrated in large biotech companies, such as Amgen, Gilead Sciences, Biogen, etc.

    Leveraged Biotechnology ETF

    Direxion Daily S&P Biotech Bull 3X Shares (LABU):Providing a 3x leveraged bullish exposure to the S&P Biotechnology Select Industry Index. High risk, high return, suitable for short-term traders.

    ProShares Ultra Nasdaq Biotechnology ETF (BIB):Providing a 2x bullish leverage on the NASDAQ Biotechnology Index. The relatively lower leverage ratio is suitable for medium-term to short-term holding.

    Before choosing the right ETF, one should consider risks, maturity, market, and costs.

    ETFs like IBB and XBI are suitable for long-term holding to diversify risks.

    ARKG is quite suitable for investors who enjoy researching innovative technologies and genomics.

    For traders who are quick to enter and exit the market and can tolerate high risks, leveraged ETFs like LABU and BIB may provide greater profit opportunities, but they come with high volatility and risks.

    Disclaimer: The content of this article is for reference only and does not constitute investment advice. Investing involves risks, so caution is advised when entering the market.

  • Retail Investors Must Learn: Why First-Mover Advantage Can Ruin “Pie in the Sky” Stocks

    When people hold excessively optimistic expectations for these popular small-cap and growth stocks, the concept of “first-mover advantage” is often mentioned. It seems that these companies naturally possess a “first-mover advantage” before establishing a solid moat or accumulating a large base of loyal customers.

    However, I would like to remind readers that before a company truly achieves overwhelming results, the “first-mover advantage” is merely a pseudo-concept, filled with wishful optimistic analysis rather than objective and calm judgment. Otherwise, readers might be blinded by the so-called “first-mover advantage,” just like I was. The following two stocks are examples of two other “pie in the sky” companies that I was once deceived by.

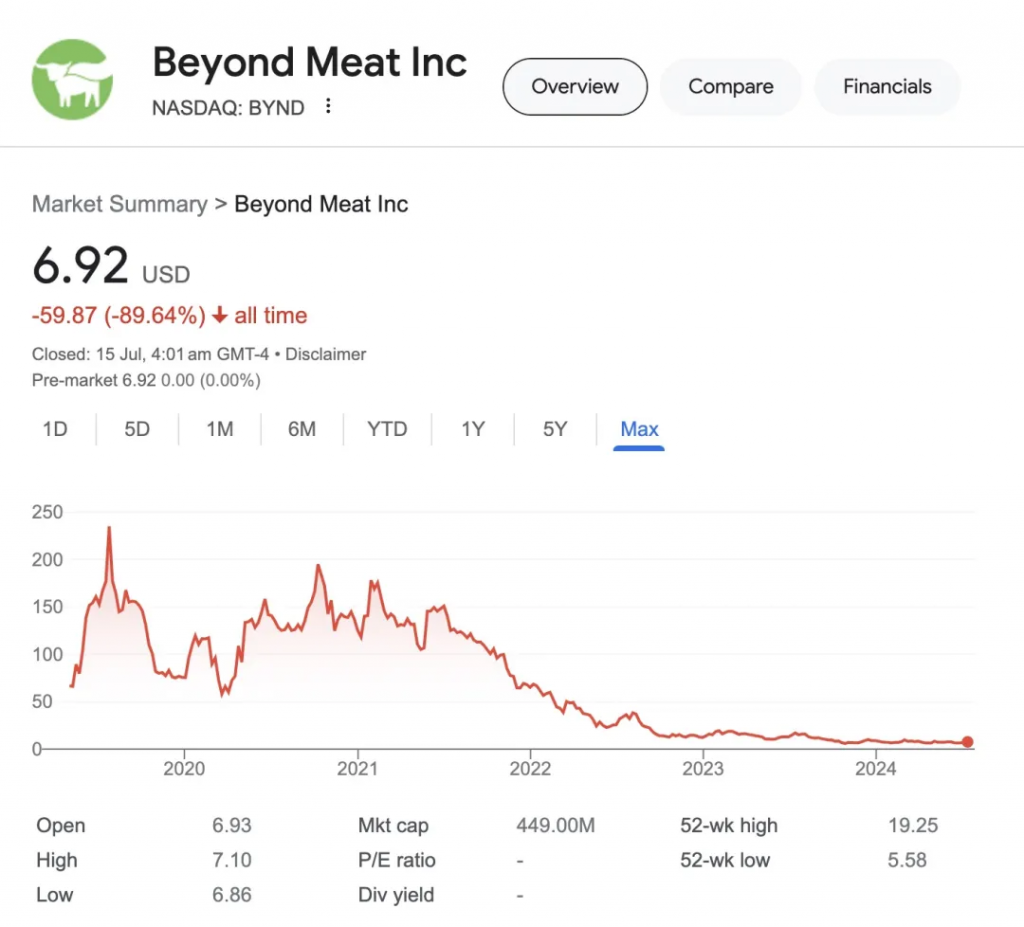
    Beyond Meat ($Beyond Meat(BYND.US)$): Plant-based meat company

    International market expansion: In 2020, Beyond Meat actively explored international markets, especially entering China, the world’s largest meat consumption market. The company’s layout in the mainland Chinese market was considered to have a first-mover advantage, coinciding with the budding development of the plant-based meat market.

    Brand recognition: As the “first plant-based meat stock,” Beyond Meat’s brand first-mover advantage is widely recognized. In the plant-based meat race, the company’s brand awareness and market share lead other competitors.

    Channel layout: Despite the impact of the COVID-19 pandemic in 2020, Beyond Meat still achieved revenue growth through international channels. The company’s early layout in retail and food service channels provided it with a competitive advantage.

    Technological innovation: Beyond Meat continued to invest in R&D in 2020, planning to establish an R&D center in Shanghai. This innovative strategy helps to consolidate the company’s technological leadership.

    Stock performance and current operations:

    The IPO in 2019 was very strong, reaching a historical high of $234.9 in July. It closed at $125 in 2020, up 65.3% from the beginning of the year. It closed at $65.16 in 2021, down 47.9% for the year. It closed at $12.3 in 2022, down 81.1% for the year. It closed at $8.9 in 2023, down 27.7% for the year. As of July 11, 2024, Beyond Meat’s stock price was $6.84.

    Current operations: The company has been under pressure to make a profit and has been operating at a loss since 2019. The net loss in 2023 expanded to $338 million, with a net profit margin of -98.48%. The poor taste leading to weak demand for plant-based meat is one of the main challenges faced by Beyond Meat. Revenue decreased by 9.9% in 2022 and by 18% in 2023.

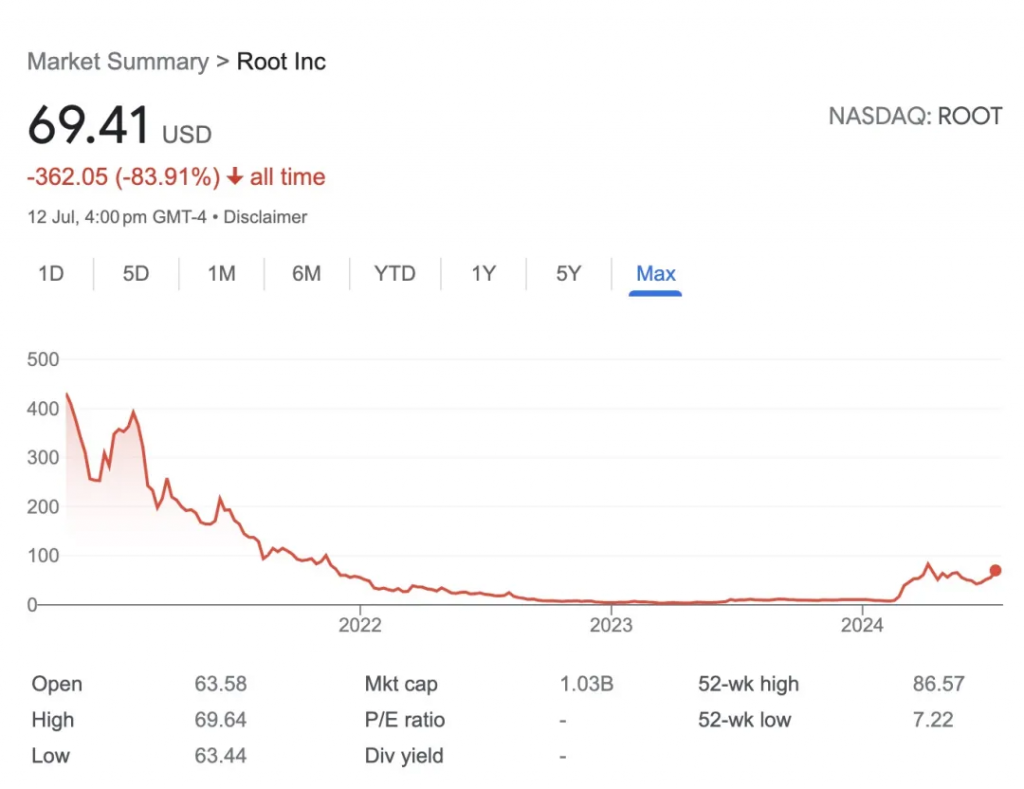
    Root Insurance ($Root Inc(ROOT.US)$): The “innovative” car insurance company that “disrupted” the traditional car insurance industry

    Driving behavior-based pricing model: Root Insurance broke the traditional car insurance pricing model through its unique “test drive” feature and telematics technology. Root’s policy prices are mainly based on the customer’s driving behavior, which allows them to provide safer drivers with lower and fairer premiums. This innovative pricing model not only attracts a large number of customers but also gives Root a clear technological advantage in the market.

    Mobile-first customer experience: All of Root’s operations can be completed through its mobile app, including getting quotes, purchasing policies, managing policies, and submitting claims. This paperless, simplified process provides a high-quality customer experience, making insurance purchase and management more convenient.

    Data-driven risk assessment: Root uses machine learning and data analysis to optimize its pricing models and risk assessments. This not only improves the accuracy of pricing but also reduces the occurrence of fraud. In addition, Root’s automated processes make claim processing faster, usually completed within 5 days, while the industry average is 12 days.

    Revenue growth: From the data, Root’s revenue growth trend is very optimistic. The company’s total revenue grew from $43.3 million in 2018 to $347 million in 2020, a sevenfold increase. This rapid growth shows the market’s recognition and acceptance of Root’s innovative model.

    Stock performance and current operations:

    Root went public on NASDAQ in October 2020, and its stock price showed a typical “high open and low walk” pattern. It was sought after in the early stages of listing but then experienced a long-term decline. From the high point in November 2020 to the low point in March 2023, it fell by more than 85%. There has been a rebound since 2023, but it is still far below the IPO price.

    Although Root’s net loss has narrowed year by year since 2021, it has not yet made a profit, with a net profit margin of -32.4% in 2023.

    It is clear that although the above two companies were the first to explore the market in new segments or tracks, this does not mean that they have a real “first-mover advantage.” Just like Liu Bei in the early Three Kingdoms period, he first occupied Xuzhou but ultimately failed to hold it.

    In my view, to determine whether a company has a “first-mover advantage,” the key is whether it has a dominant market position and whether its main customer base will easily turn to competitors when they appear.

    If the customer base is enterprises, then whether the company’s products are deeply integrated with the customer’s data or products, making it costly for customers to turn to competitors. For example:

    • Integrated circuit design company: $Cadence Design Systems(CDNS.US)$ and $Synopsys(SNPS.US)$
    • Semiconductor manufacturing company: $Taiwan Semiconductor Manufacturing Company(TSM.US)$
    • Automatic data processing company: $Automatic Data Processing(ADP.US)$ – providing payroll services, human resource management, benefits management, etc.
    • Minimally invasive surgical robot company: $Intuitive Surgical(ISRG.US)$

    If the customer base is individual consumers, then whether the company’s products are:

    • Irreplaceable: such as the luxury goods company Hermès (not listed), $LVMH Moet Hennessy Louis Vuitton(LVMUY.US)$
    • Product stickiness: such as Apple ($Apple(AAPL.US)$)
    • Low-price marketplace: such as Costco ($Costco(COST.US)$)
    • Many stores and deeply rooted: such as McDonald’s ($McDonald’s(MCD.US)$) and Starbucks ($Starbucks(SBUX.US)$)

    In summary, “first-mover advantage” is not just about being the first to enter; it also requires consolidating market position through advantages in technology, brand, channels, innovation, and customer stickiness, truly do not be easily replaced in the competition.

    However, when people excessively pursue the “first-mover advantage” of small-cap and growth stocks, they often overlook the real first-mover advantages of many large-cap and high-quality stocks, and are even too pessimistic about their performance.

  • 5 Ways to Spot and Avoid “Pie in the Sky” Stocks [Essential for US Retail Investors]

    Stay Away from “Pie in the Sky” Stocks

    The market is never short of stocks that are primarily driven by storytelling to inflate their prices. These are called dream stocks, which emerged like mushrooms after rain in 2020-2021, with stock prices soaring daily, creating various wealth myths that are tempting.

    The characteristics of dream stocks are: no actual profits, only appealing stories and enticing prospects, with a price-to-earnings (PE) ratio that is in line with the market average. For such stocks, the author prefers to affectionately call them “pie in the sky” stocks.

    However, without real profits to support them, no matter how touching the story, the surge in stock prices is just a short-term speculation and a stock market carnival, which will eventually end up with a plunge in stock prices and a bitter defeat.

    Indeed, whether stock prices can rise depends on future earnings and growth, to be precise, largely on expectations and prospects for the future. Of course, we have emphasized many times that the future is unpredictable. Management plans are just plans, and whether they can be executed and how effective they are is unknown.

    So, what can we rely on?

    We focus on business models and management teams that have been proven by the market. Although future performance cannot be guaranteed, there is a performance inertia in excellent companies in the market, and assuming that the company’s future performance will be similar to the past has a higher probability of being correct.

    This is because consumer behavior (both individual and corporate) has inertia; excellent products used this year will likely continue to be purchased and used by the same brand next year. The performance inertia brought by excellent business models is almost the only predictability we can trust in the stock market.

    The market is often generous in giving high stock prices to excellent companies. For excellent stocks, value investors’ opportunities come from the failure of the market’s efficient assumption. The market efficiency theory assumes that the market is rational and can price assets reasonably in real-time. However, the market is always overly pessimistic about bad news, which provides a window for undervaluing high-quality assets.

    For example, recently NKE’s stock price fell by 20% on June 27-28 due to poor financial performance and a downward revision of future prospects, setting the largest single-day drop since 2001.

    However, looking back at NKE’s ROE over the past 10 years, it has been above 25% for 9 years, and the current ROE is as high as 37%. Judging solely from ROE, NKE may be a very excellent company, and a one-day drop of 20% may provide an entry opportunity for value investors.

    Looking back at NKE’s performance over the past few years, there have been several instances where it did not meet market expectations, affecting short-term stock performance:

    • In the fourth quarter of 2023, NKE’s net profit decreased by 28% year-on-year, missing market expectations.
    • In the fourth quarter of 2022, revenue was $12.6 billion, below analysts’ expectations of $12.8 billion.
    • In the second quarter of 2022, overall revenue increased by 1% year-on-year, but revenue in the Greater China region and the Asia-Pacific and Latin America region decreased.
    • In the third quarter of 2021, overall revenue increased by 3% year-on-year, but revenue in North America decreased by 11%.

    As NKE’s stock price trend shows, market pessimism is short-lived, and the inertia of excellent business models is relatively long-lasting. As long as time is given, the market will once again give reasonable stock prices to excellent companies.

    Therefore, by buying undervalued stocks and waiting for the market to return to a reasonable valuation, value investors have the opportunity to make a profit.

    However, the same logic cannot be applied to “pie in the sky” stocks. Our most basic requirement for investment targets is positive earnings. Investing in stocks without positive earnings is not without the opportunity to make money, but it requires the same level of risk as venture capital because there is a lack of reliable valuation basis, and buying at a high premium is the norm.

    However, stock investment does not have the risk control advantages that venture capital has. Venture capital has more diverse exit mechanisms compared to stock investment, which helps to reduce risks. In addition, venture capitalists often participate deeply in the operation and management of the invested companies, using their advantageous position to further reduce risks.

    Finally, the capital gains of venture capital in the same period are far higher than those of stock investment. Therefore, treating stock investment as venture capital is not advisable.

    In addition, the author particularly points out that unlike high-quality stocks (which can make investors profit by holding long-term and waiting for the stock price to return to its intrinsic value), holding “pie in the sky” stocks for a long time will also likely result in losses.

    The author has also made a mistake with “pie in the sky” stocks, thinking that if a stock is stuck, as long as you hold it and do not move, you will not really lose money. In fact, after a sharp drop in the price of “pie in the sky” stocks, they may be delisted or acquired at a low price, causing permanent capital loss for investors.

    Next, the author would like to share two painful personal experiences with “pie in the sky” stocks. I believed the big pies painted by the media and analysts for these stocks. Although I bought them when the stock price had plummeted more than 50% from its peak, I still suffered a loss of more than 90%. Now, please enjoy the pies painted by the analysts at that time.

    VLDRW Pie:

    • At the beginning of 2020, Velodyne was seen as the leader in the lidar industry, holding more than 90% of the market share, and its sensors were used in autonomous driving, robotics, drones, and other fields.
    • In February 2020, when Velodyne released its financial report, it stated that it expected to generate more than $1 billion in revenue from 2021 to 2025, with more than $4.4 billion in 190 potential projects.
    • In July 2020, Velodyne went public through a SPAC, with its valuation increasing from about $1.8 billion to $3 billion. The market expected its turnover to grow sevenfold from about $100 million in 2019 to $685 million in 2024 (doubling every year).
    • In December 2020, a Wall Street analyst gave Velodyne a bullish rating, driving up the stock price. The analyst believed that Velodyne had a “clear first-mover advantage” in the lidar sensor category, which is the core of ADAS and autonomous driving. By 2024, about 60% of new vehicles equipped with ADAS systems will be equipped with lidar, and the cost of automotive-grade lidar will be reduced to less than $600.

    VLDRW End:

    • In 2021, the Chinese company Hesai Technology quickly rose to challenge Velodyne’s market position. Velodyne’s poor service in the Chinese market, along with serious product quality and repair issues, led to Hesai Technology occupying 67% of the lidar market share in the autonomous taxi industry.
    • The company continued to lose money every year from 2019 to 2020, reaching a historical high of about $32 per share in December 2020. By the end of 2021, Velodyne’s market value had shrunk significantly. It later merged with Ouster, at which point Velodyne’s stock price had already fallen to about $0.9 per share.

    PTON Pie: (Excerpted from a deep analysis by a US stock investment blogger in 2020)

    • Peloton is known as the “Netflix of the fitness industry.”
    • In 2020, Peloton announced its third-quarter financial report, showing a 66% increase in total revenue to $520 million, far exceeding Wall Street’s expectations of $480 million. This growth rate is astonishing for an already publicly traded mature asset.
    • Wall Street tycoon Soros took a position in PTON. For such a prestigious and professional investment institution, he must go through a very strict due diligence and screening process from ideal to investment implementation. In short, he must completely analyze a company before implementing the investment. If there is a problem with any detail, the investment project is killed. Therefore, no matter how much Soros invests, it indicates that Peloton has emerged from the selection and is a very high-quality asset.
    • How good is Peloton’s financial report? The company’s fitness equipment end-users grew by 94% last quarter, and online fitness course subscribers grew by 64%. Overall, Peloton’s retention rate within 12 months is 93%. Peloton’s gross margin has also increased significantly to 46.8%.
    • The CEO stated that seeking profits is not the company’s current top priority, and seeking rapid growth is more important than seeking profits in the short term.
    • Peloton combines intelligent fitness hardware with high-quality content, disrupting the traditional home fitness model.
    • The market worries that after the pandemic, Peloton’s growth momentum may fall rapidly. In response, founder John Foley said that Peloton’s user base has grown at a rate of over 100% for six consecutive years, and the company’s revenue and growth are healthy regardless of the pandemic.
    • Peloton does very well in both hardware and content, but essentially it is still a product company, with hardware sales contributing to most of the revenue, and it is the excellence of the hardware that makes Peloton’s hardware + content business model strong enough.

    PTON Ending:

    • After seven or eight years of listing, Peloton has never had a positive surplus. The stock price has fallen 98% from its peak of $162 at the end of 2020 to about $3 today (one-tenth of the IPO price).

    These personal experiences have made the author deeply realize the risks and pitfalls of “pie in the sky” stocks.

    The author hopes that readers can learn from these experiences to avoid repeating the same mistakes in future investments. If investors want to invest in growth stocks, they can refer to the technology maturity cycle to assess the right time to invest. Investors can wait for the bubble to burst and then enter cautiously, instead of taking great risks to participate in the market’s carnival during the technology germination period and the expectation inflation period.

    Gartner believes that a new technology or some innovation will go through the following five stages from development to final maturity:

    1. Technology Trigger Stage: In this stage, the media reports extensively, irrationally, and the product’s popularity is everywhere. However, with the emergence of the technology’s shortcomings, problems, and limitations, there are more failed cases than successful ones. For example, .com companies experienced an irrational surge during 1998-2000.

    2. Expectation Inflation Period: Excessive public attention in the early stage has led to a series of successful stories – of course, there are also many failed examples. For failures, some companies have taken remedial measures, while most companies remain indifferent.

    3. Bubble Burst Trough Period: The technology that has survived the previous stages has undergone solid and focused experiments, and has an objective and practical understanding of the scope and limitations of the technology, and successful and viable business models gradually grow.

    4. Steady Climb Recovery Period: In this stage, new technologies receive high attention from major media and the industry in the market. For example, the Internet and Web technology in 1996.

    5. Production Maturity Period: In this stage, the benefits and potential of new technologies are actually accepted by the market, and the tools and methods supporting this business model have evolved through many generations, entering a very mature stage.

    Finally, the author leaves a question for readers: Would you buy a stock like this?

    VKTX: No business revenue, losses are expanding year by year, with a loss of $100 million in the latest year. The stock price soared to a maximum of $99 between February and March this year, and then slowly fell to about $55. Then please enjoy the optimistic evaluation of analysts at the end of 2023.

    • Viking Therapeutics is a clinical development-stage biopharmaceutical company focused on the research and development of treatments for endocrine disorders and other metabolic diseases. The company’s product line features new therapies, which are either first-class or the best, and are designed as oral small molecule compounds.
    • Oppenheimer analyst Jay Olson points out the potential of Viking’s main drugs VK2809 and VK2735, especially for metabolic diseases such as NASH and obesity.
    • VK2809 showed a positive effect on reducing liver fat in phase 2b clinical trials, and the phase 2 trial for VK2735 to treat obesity is underway. Phase 1 trial data show that the candidate drug has good tolerance and acceptable safety under various dosing schemes.
    • Olson gives VKTX an “outperform” rating, with a target price of $40, which means the stock has the potential to rise by 200% in the next year.
  • Is the rate cut still focusing on blue-chip stocks? Let’s see how growth stocks outperform the S&P 500. [Investing in US Stock ETFs]

    Will the fate of blue-chip stocks and small to mid-cap growth stocks start to shift gears now?

    Recently, the market has been quite interesting. Blue-chip stocks are fluctuating at high levels, while the Russell 2000 Index, this little brother, suddenly becomes active. Is the market about to change?

    Blue-chip stocks have been strong for two years. Now, with a rate cut, is it time for small and mid-cap growth stocks to shine?

    Looking back at Russell 2000’s investment pace, are there any good entry points?

    Considerations for Investing in the Russell 2000 Index

    Several potential favorable opportunities and considerations:

    Strong economic growth. Small and mid-cap companies are sensitive to economic growth, so when the economy is doing well, they take off!

    Decreasing interest rates. Lower interest rates or stable rates mean lower borrowing costs, which is beneficial for small and mid-cap companies.

    Investors willing to take risks. When market sentiment is positive, people are more willing to invest in high-risk, high-return stocks, making small and mid-cap stocks more popular.

    Positive earnings expectations for companies. If everyone believes that small and mid-cap companies will be profitable, their stock prices may rise accordingly.

    Strong technical indicators. Technical analysis sometimes indicates the right time to buy, such as when the Russell 2000 Index breaks through resistance levels or when the 50-day moving average crosses above the 200-day moving average (golden cross).

    Market downturn. The valuation of small and mid-cap stocks may become more attractive!

    Specific strategies include:

    Don’t try to buy at the lowest price in one go; gradually buy in batches to lower the average cost and risk.

    During earnings season, pay attention to companies that exceed profit expectations, as their stock prices are likely to rise.

    Stay informed about economic policies as these changes can affect your investment strategy, requiring timely adjustments.

    Small and mid-cap growth stocks are volatile, so patience is key. Only by not being swayed by short-term fluctuations can you seize long-term growth opportunities!

    The performance of the Russell 2000 during historical interest rate cutting cycles.

    From 2001 to 2003, following the bursting of the dot-com bubble and the 9/11 attacks, the Federal Reserve significantly lowered interest rates in an effort to boost the economy.

    Despite market turbulence, the Russell 2000 Index performed well in 2001, rising by 2.5%.
    In 2002, with the economy still struggling, the Russell 2000 fell by 21.6%, showing more resilience compared to large-cap stocks.
    In 2003, as the economy began to improve, the Russell 2000 surged by 45.4%, outperforming the S&P 500 Index by a significant margin.

    During 2007-2008, the subprime mortgage crisis hit, prompting the Federal Reserve to lower interest rates from 5.25% to 0-0.25%.
    The Russell 2000 saw a modest increase of 1.5% in 2007, but in 2008, amidst the financial crisis, it plummeted by 34.8%, similar to the decline in the S&P 500.
    By 2009, with the coordinated efforts of the Federal Reserve and the government to stabilize the market, the Russell 2000 rebounded, ending the year with a 27.2% gain.

    From 2019 to 2020, global economic growth slowed down, exacerbated by the COVID-19 pandemic, leading the Federal Reserve to lower interest rates from 2.5% to 0-0.25%.
    In 2019, following the rate cut, the Russell 2000 surged by 23.7%; however, with the outbreak of the pandemic in early 2020, the market became chaotic, and the Russell 2000 also experienced a significant drop in the first quarter.
    But with the subsequent strong policies implemented by the Federal Reserve and the government, the index quickly rebounded, ending the year with an 18.4% gain.

    During the early stages of an interest rate cut cycle, it is crucial to seize opportunities, closely monitor policy changes and economic data, adjust investment strategies promptly, and maintain a long-term perspective.

    Growth stock ETFs worth paying attention to.

    Standard Russell 2000 ETF

    iShares Russell 2000 ETF (IWM): IWM is one of the most popular ETFs tracking the Russell 2000 Index, with an expense ratio of 0.19%. It boasts high liquidity, large trading volume, and is suitable for both long-term holding and short-term trading.

    Triple-Leveraged ETF for Long Russell 2000

    Direxion Daily Small Cap Bull 3X Shares (TNA): TNA is a triple-leveraged ETF for long exposure to the Russell 2000 Index, aiming to achieve three times the daily return of the index. It has an expense ratio of 1.08% and is suitable for short-term trading.

    ProShares UltraPro Russell 2000 (URTY): URTY is another triple-leveraged ETF for long exposure to the Russell 2000 Index, with an expense ratio of 0.95%. It offers similar triple leverage to TNA and is suitable for short-term strategies.

    Other Related Small and Mid-Cap ETFs

    Vanguard Small-Cap ETF (VB): VB tracks the CRSP US Small Cap Index, including some small-cap stocks beyond the Russell 2000 Index, with an expense ratio of 0.05%. It is suitable for long-term investment.

    Schwab U.S. Small-Cap ETF (SCHA): SCHA tracks the Dow Jones U.S. Small-Cap Total Stock Market Index, providing broad exposure to U.S. small-cap stocks. It has an expense ratio of 0.04% and is suitable for long-term holding.

    Depending on your investment goals and risk tolerance, you can choose the appropriate ETF. IWM is the standard choice for tracking the Russell 2000 Index, while TNA and URTY are triple-leveraged ETFs for short-term traders. For long-term investors, VB and SCHA are low-cost quality options.

    Disclaimer: The content of this article is for reference only and does not constitute investment advice. Investing involves risks, so caution is advised when entering the market.

  • Gold strategy for novice investors: interest rate cuts, gold price increases, and simple ETF investments all at once! US Stock ETF Investment

    Recently, the Federal Reserve has cut interest rates by 50 basis points, and many people are wondering, what does the US interest rate cut concern us? Let me explain here:

    Why does a rate cut lead to an increase in gold prices?

    When the Federal Reserve cuts interest rates, the market usually expects the US dollar to depreciate, and gold, as a safe haven asset, often performs strongly when the US dollar weakens. In addition, interest rate cuts usually mean a decrease in the level of interest rates, which reduces the attractiveness of holding fixed income assets such as bonds, leading investors to turn to precious metals such as gold in search of higher returns.

    What are the ways to invest in gold?

    Firstly, for investing in physical gold, it is the least cost-effective option, but it has an invaluable function of promoting family harmony;

    Secondly, paper gold and gold futures have certain thresholds for ordinary investors;

    The simplest way is to purchase a gold ETF.

    What is a gold ETF?

    Gold ETF is a financial derivative product whose underlying asset is physical gold or gold futures contracts. This fund product allows investors to indirectly invest in gold by purchasing fund shares without actually holding gold bars or coins.

    Gold ETFs are usually listed and traded on stock exchanges, with high liquidity and low management fees.

    Is now the best time to configure?


    This depends on multiple factors. From historical data, gold ETFs have performed well in high-risk, low interest rate environments and are often favored by investors when global economic uncertainty increases.

    However, the volatility of the market means that the timing of buying needs to be carefully grasped. For example, in the context of gold prices repeatedly hitting new highs, investors should pay attention to market dynamics and macroeconomic indicators to determine whether it is suitable to enter the market.

    The goal of SPDR Gold Trust (GLD) is to track the performance of gold spot prices. The fund maintains a close relationship with the spot price of gold by holding physical gold and issuing or redeeming fund units based on market demand.

    GLD is traded on the New York Stock Exchange and has high liquidity, allowing investors to trade as conveniently as buying and selling stocks. Due to its wide market acceptance, the bid ask spread (the difference between the buy and sell prices) of GLD is usually small.

    Of course, GLD provides a convenient investment pathway, but there are also some risks involved: for example, fluctuations in gold prices can directly affect the value of GLD;

    Despite high liquidity, there may be liquidity risks under extreme market conditions.

    The goal of iShares Gold Trust (IAU) is to provide investors with an investment tool that reflects the performance of spot gold prices by holding physical gold. Funds maintain a close relationship with the spot price of gold by purchasing and holding physical gold, and issuing or redeeming fund units based on market demand.

    IAU is traded on the New York Stock Exchange and has high liquidity, allowing investors to trade as conveniently as buying and selling stocks. Due to its wide market acceptance, the bid ask spread (the difference between the buy and sell prices) of IAU is usually small.

    Similarly, IAU and GLD both have similar risks.

    SPDR Gold Trust (GLD) and iShares Gold Trust (IAU) both provide investors with a simple, cost-effective, and highly liquid way to invest in gold. By holding physical gold, both aim to closely track the spot price of gold, providing investors with direct exposure to the gold market.

    However, investors should still fully understand the related risks and costs when considering investing in gold ETFs, and make decisions based on their investment goals and risk tolerance.

    Disclaimer: The content of this article is for reference only and does not constitute investment advice. Investment carries risks, and caution is necessary when entering the market.

  • Boeing Pleads Guilty and Accepts Penalty! From a Giant to a “Junk Stock” – How Can Retail Investors in US Stocks Avoid the Minefield of Earnings Culture?

    Don’t look for investment opportunities in junk stocks, but consider stocks that deal with waste.

    In my recent articles “Why First-Mover Advantage Ruins Big-Name Stocks” and “5 Ways to Spot and Avoid Big-Name Stocks [Essential for US Retail Investors],” I discussed several junk stocks (PTON, VLDN, BYND, ROOT) with the aim of reminding readers not to invest their precious capital in these junk stocks.

    However, junk stocks are not limited to certain small-cap stocks; some large-cap stocks may also be considered junk. Recently, I noticed some people asking in stock review programs whether Boeing’s stock (BA) is worth investing in.

    Although Boeing is one of the world’s largest aerospace manufacturers and has a glorious history and outstanding achievements, and I personally had the honor of visiting its huge factory in Seattle in 2017 and was quite fascinated by it.

    In my view, Boeing has unfortunately been included in the ranks of junk stocks. The root cause lies in its decadent corporate culture and dishonest management.

    In the early days, Boeing’s corporate culture was centered on an engineer culture, which was specifically reflected in the emphasis on engineering and technology, focusing on product safety, quality, and innovation. Engineers had a high degree of autonomy in the decision-making process, and innovation and technological breakthroughs were encouraged. The company focused on the sustainability of long-term projects and technological development, not just short-term financial returns.

    However, over time, Boeing gradually shifted towards an earnings culture, prioritizing financial performance and focusing more on quarterly profits, shareholder returns, and stock prices. The company’s management is dominated by personnel with financial backgrounds, not engineers.

    This shift has led to an increase in product quality and safety issues, the most notable example being the development of the 737 MAX. To cope with market pressure, Boeing adopted an “extremely compressed” timetable in the development of the 737 MAX, leading to design flaws in the MCAS system.

    This system relied on a single sensor, leading to two fatal crashes that resulted in 346 deaths (in 2018 and 2019), shocking the world, and I believe many readers still remember this vividly. In addition to this, the 737 MAX had other quality issues that exposed Boeing’s negligence in quality control.

    In recent years, several whistleblowers have accused Boeing of safety hazards, insufficient quality control, and problems in the production process. Disgracefully, these whistleblowers have been retaliated against, including being ostracized, demoted, and fired.

    Among them, John Barnett, a former quality control manager, exposed safety issues with the 737 MAX aircraft, and Joshua Dean, a quality auditor for a Boeing supplier, exposed manufacturing defects in the 737 MAX. Both have recently passed away, drawing outside attention.

    However, Boeing CEO Calhoun only admitted that “there was a problem,” but denied the existence of systemic retaliation. At a Senate hearing, when questioned about the retaliation against whistleblowers, his responses were either evasive or he directly avoided the issue.

    Integrity and competence in management are one of the important criteria for Warren Buffett when evaluating companies. Buffett once said, “Never do business with people who are not honest, because even if you make an agreement with them, they may break their promises.”

    For example, PTON’s CFO clearly stated during the Q2 2020 financial report that there would be no additional stock issuance, but soon after, the company did issue more stock, causing its stock price to fall by about 65% in the following six months, causing losses to many investors (including me, TAT).

    This is mainly because it is generally difficult for ordinary investors to judge whether the management is honest and competent, but this does not mean that the quality and ability of the management are not important. Once there are signs of dishonesty in the management, ordinary investors do not need to waste time studying this company, because you cannot predict what kind of mine this company will explode, causing the stock price to plummet or even be halved, resulting in huge losses.

    Although analysts from Goldman Sachs and other institutions (a total of 54) are optimistic about Boeing’s long-term prospects and maintain a “buy” rating (with Goldman Sachs analysts even giving a target price of $243), in my view, before Boeing completely turns around its earnings culture, ordinary investors should stay away from such companies.

    Otherwise, in addition to aircraft safety and quality issues, the management may also plant mines in the financial reports. Boeing’s long-term debt soared from $19.96 billion in 2019 to $61.89 billion (with debt scales all less than $13.5 billion before 2018), and the debt-to-equity ratio skyrocketed from 0.65 in 2013 to 40.85 in 2018, and shareholders’ equity turned negative after 2019.

    It is puzzling that Boeing turned from profit to loss from 2019 (net income of $8.458 billion in 2017, $10.546 billion in 2018, and a net loss of $636 million in 2019), but still spent a lot of money on stock buybacks ($18 billion in 2017, $20 billion in 2018, both higher than the net income of the same year), until the $20 billion new stock buyback plan was halted in 2019 due to the 737 MAX crisis.

    It can be said that the management has hollowed out the company through the stock buyback plan, driving up the stock price and making themselves rich. The unhealthy financial situation and unreliable profitability left by the management for Boeing mean that any slight disturbance can cause violent fluctuations in the stock price.

    In this article, I mainly warn readers to stay away from various junk stocks, but some stocks that deal with waste are worth the attention of ordinary investors, such as WM and RSG (note that the current price may not be suitable for purchase). Specific stock analysis will be shared with readers in the next article, so please continue to follow.

  • Which sectors are benefiting from the US interest rate cut? US Stock ETF Investment

    “Domestic investors can also enjoy the dividend of interest rate cuts in the US stock market

    With the news of interest rate cuts in September, small and medium-sized stocks that were previously struggling to catch their breath can finally feel relieved. So we must seize the dividends brought by interest rate cuts!

    Huabao Overseas Technology QDII-LOF (501312)

    Huabao Overseas Technology QDII-LOF (Class A: 501312/C: 017204): This fund specializes in investing in overseas innovative technology and small and medium-sized technology stocks. It invests in multiple ARK series ETFs and other technology related ETFs.

    Its fund manager and team have a special understanding of the technology industry, rich research experience, and seasoned investment techniques. The goal is to bring long-term stable profit returns to investors!

    Huabao Overseas Technology Fund adopts a combination of top-down and bottom-up stock selection methods.

    Top down, determine the overall investment direction and industry allocation through macroeconomic analysis, industry trend research, etc; Priority should be given to technology fields with high growth potential, such as artificial intelligence, financial technology, genetic technology, etc.

    Bottom up, selecting specific investment targets through fundamental analysis of individual stocks or ETFs; Pay attention to the financial condition, growth potential, and market performance of individual stocks or ETFs.

    Starting from April 11, 2023, the performance of this fund is similar to that of the Nasdaq 100 index, with good growth potential, high elasticity, and better performance in overseas markets compared to the CSI 300.

    When investing in this fund, it is important to note that technology stocks have significant fluctuations, and changes in market sentiment can lead to significant fluctuations in the fund’s net asset value. It should also be noted that funds may face significant drawdown risks during market adjustments or declines.

    Why have you performed exceptionally well recently?

    Why is it necessary to allocate a biotechnology index during the interest rate cut cycle?

    As a typical long-term asset, biotechnology companies generally have long research and development cycles and large investments. They are sensitive to interest rates, so when the Federal Reserve cuts interest rates, it is cheaper for them to borrow money to continue research and development.

    Recently, due to the unexpected drop in US CPI in June and the dovish stance of Federal Reserve Chairman Powell, market expectations for interest rate cuts have further rebounded.

    Once the interest rate cut cycle begins, small and medium-sized technology enterprises that are particularly sensitive to interest rates may usher in new investment opportunities. These enterprises generally have high flexibility and are easy to attract investors’ attention.

    Driven by disruptive innovation factors such as intelligent driving, artificial intelligence, and genetic innovation, the ARK series funds have performed strongly since July, driving the overall performance of Huabao Overseas Technology QDII-LOF. 

    ARKQ has accumulated an increase of 8.66% within the month, ARKK has accumulated an increase of 8.53%, ARKG has accumulated an increase of 8.35%, ARKW has accumulated an increase of 7.18%, and ARKF has accumulated an increase of 4.24%.

    Katherine Wood, founder and CEO of ARK Investment Management, stated that many stocks related to truly disruptive innovation have entered rare areas of deep value, meaning that these stocks may currently be undervalued, but they have enormous growth potential.

    On July 16, 2024, Huabao Overseas Technology QDII-LOF performed outstandingly, hitting the daily limit up in the morning session and reaching a high of 1.596 yuan on the market, indicating strong market demand for it.

    Approaching 14:00, there was another surge in volume, with an increase of over 5% within the market, setting a new historical high!

    The amplitude exceeded 10% throughout the day, indicating that the fund was very active in trading on that day, with a turnover of 145 million yuan, setting a new high in daily volume and a month on month increase of 125%.

    For those who are optimistic about the development of the technology field, they can consider holding it for the long term to obtain returns from high growth.

    Due to the high volatility of the fund, overall risk can be reduced by diversifying investments.

    Regularly adjust the investment portfolio, optimize returns, and balance risks based on market conditions and one’s own risk tolerance.

    Disclaimer: The content of this article is for reference only and does not constitute investment advice. Investment carries risks, and caution is necessary when entering the market.

  • What hedge funds to buy when the US stock market plunges?【Investing in US stock ETFs】

    “ The U.S. stock market experienced a sharp decline. Worried about potential significant short-term volatility while aiming for long-term investment, considering adding some hedge ETFs.”

    Recently, the U.S. stock market has been quite unstable, especially in the semiconductor sector. With high expectations from everyone, industry giants are facing tough earnings seasons. Therefore, if their performance falls slightly short, stock prices will plummet.

    On July 17th, ASML’s earnings fell short of expectations, triggering a sell-off in the semiconductor sector, which in turn led to a sharp decline in Nasdaq’s tech stocks. The seven giants recorded their largest single-day drop in over a year!

    The mother of all chips triggers semiconductor meltdown.

    One stone stirs up a thousand layers of waves. Due to poor performance of ASME, it has encountered policy setbacks.
    On July 17th, semiconductor and technology giants were sold off. On Wednesday, the market value of the Wall Street Semiconductor Index evaporated by over $500 billion, marking the worst trading day since 2020.

    On the other hand, the United States has strengthened its control over semiconductor exports to China. President Trump has made strong statements about targeting TSMC. The recent sharp decline in Wall Street’s semiconductor stocks reflects the market’s sensitivity to geopolitical risks and policy changes.

    Recently, the semiconductor industry has become a focal point in the technological competition between China and the United States. The U.S. government is taking measures to protect its own advantages, which has caused some anxiety in the market and affected investor confidence. In this situation, it is important to closely monitor policies and international developments to better understand the risks and opportunities in the market.

    The ASML incident has sounded the alarm for the semiconductor industry, indicating potential soft demand or supply chain issues.

    Faced with this situation, investors can consider diversifying their investments by allocating to multiple industries and categories to reduce the impact of a single industry on the overall investment portfolio.

    Alternatively, they can consider investing in multiple countries and regions to diversify geopolitical risks.

    Utilize hedging tools, such as shorting hedge ETFs like ProShares Short QQQ (PSQ), ProShares UltraShort QQQ (QID), Direxion Daily Semiconductor Bear 3x Shares (SOXS), etc.

    Use put options to protect against market downturns.

    Carefully analyze the fundamentals of companies and select those with long-term growth potential and stable finances.

    During market volatility, remain calm and avoid panic selling. Dollar-cost averaging can help smooth out fluctuations.

    Are you looking to hold for the long term but concerned about significant short-term fluctuations?

    Shorting hedge ETFs

    Specific stock category

    For example, Nvidia, the GraniteShares 2x Short NVDA Daily ETF (NVD.US), is a double inverse ETF designed specifically for shorting Nvidia (NVIDIA) stock. There are also others like AMDS, NVDS, FNGD, etc.

    Index category

    ProShares Short QQQ (PSQ):This ETF aims to provide inverse performance of the Nasdaq-100 Index, meaning that when the Nasdaq-100 falls, PSQ will rise. It is suitable for hedging against investment risks related to technology stocks and the Nasdaq-100 Index.

    ProShares UltraShort QQQ (QID):This ETF aims to provide twice the inverse daily performance of the Nasdaq-100 Index, meaning that when the Nasdaq-100 falls by 1%, QID will rise by 2%. It is suitable for short-term hedging of high volatility risks in technology stocks.

    ProShares Short S&P 500 (SH):The ETF aims to provide inverse performance of the S&P 500 index, meaning that when the S&P 500 falls, SH will rise. It is suitable for hedging overall market risks, especially the impact of large-cap tech stocks on the S&P 500.

    ProShares UltraShort S&P 500 (SDS): The ETF aims to provide twice the inverse daily performance of the S&P 500 index, so when the S&P 500 falls by 1%, SDS will rise by 2%. It is suitable for short-term hedging of high volatility risks in the overall market.

    Direxion Daily Semiconductor Bear 3x Shares (SOXS):This ETF aims to provide daily inverse performance three times that of the Philadelphia Semiconductor Index (PHLX Semiconductor Index), meaning that when the Philadelphia Semiconductor Index falls by 1%, SOXS will rise by 3%. It is specifically designed to hedge risks in the semiconductor industry and is suitable for short-term high volatility market conditions.

    ProShares UltraPro Short QQQ (SQQQ):This ETF aims to provide daily inverse performance of three times the Nasdaq-100 Index, meaning that when the Nasdaq-100 falls by 1%, SQQQ will rise by 3%. It is suitable for short-term hedging of high volatility risks in technology stocks.

    There are also some ETFs that can be used for hedging and shorting specific industries or market indices.

    Tuttle Capital Short Innovation ETF (SARK):Provide the inverse performance of the ARK Innovation ETF (ARKK). Suitable for hedging risks related to ARKK.

    Direxion Daily Technology Bear 3x Shares (TECS):Provide daily triple inverse performance of the Technology Select Sector Index. Suitable for hedging risks in the technology sector.

    ProShares Short Dow30 (DOG):Provide the inverse performance of the Dow Jones Industrial Average. Suitable for hedging investment risks related to the Dow Jones Industrial Average.

    ProShares UltraShort Dow30 (DXD):Provide daily inverse performance of the Dow Jones Industrial Average at twice the rate. Suitable for short-term hedging against the high volatility risk of the Dow Jones Industrial Average.

    ProShares Short Russell2000 (RWM):Provide the inverse performance of the Russell 2000 Index. It is suitable for hedging risks in the small-cap stock market.

    ProShares UltraShort Russell2000 (TWM):Providing daily inverse performance of the Russell 2000 Index at twice the rate, suitable for short-term hedging in the high-volatility small-cap stock market.

    When using these tools, investors should fully understand their mechanisms and risks, and choose based on their own risk tolerance and investment objectives.

    Disclaimer: The content of this article is for reference only and does not constitute investment advice. Investment involves risks, please be cautious when entering the market.